Why is Internet Explorer Crashing on Shutdown? An interesting App-V-related Issue . . .
Recently, I came across something very interesting. I was working with a customer who was working with several internally developed applications that leveraged HTML files by creating links that would open them inside the user’s default browser. These applications can easily be virtualized with both App-V 5.0 and 4.6 (VAE, <LOCAL_INTERACTION_ALLOWED>)
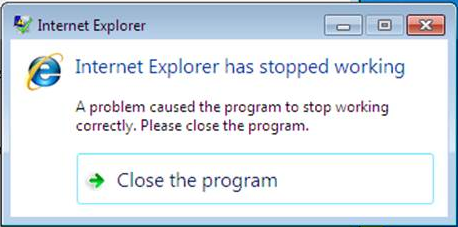
What was happening was that these applications were behaving oddly when running virtualized with App-V. The applications would trigger the local browser (running outside the bubble) for these help documents (in this example, Internet Explorer 8.) While there were no issues with this particular function, every time a user would close one of the Internet Explorer windows containing one of these documents, the window would disappear as normal. Then, almost a second or two later, a window would pop up stated that the application had crashed.
Oddly enough, we knew pretty quickly that this had to be somewhat environmental because we could never prove these issues on a vanilla test machine. This was not due to a limitation or a potential code defect within the App-V virtualization engine. After rudimentary elimination of all factors (I.E Settings, App-V, GPO, branding from the IEAK) – we decided to just cut to the chase and debug it with WINDBG to determine why we could not reproduce the issue outside the customer’s environment.
Of course there are several ways to collect user dumps (process dumps.) In this case, the issue was happening on Windows 7 so often, the default AE (Application Experience) debugger - WER (Windows Error Reporting) will suffice. We configured WER to generate a user dump by making a few registry changes.
We gave the customer the following .REG file to import into one of the offending machines.
Windows Registry Editor Version 5.00
[HKEY_LOCAL_MACHINE\SOFTWARE\Microsoft\Windows\Windows Error Reporting\LocalDumps]
"DumpFolder"=hex(2):63,00,3a,00,5c,00,64,00,75,00,6d,00,70,00,73,00,00,00
"DumpCount"=dword:0000000a
"DumpType"=dword:00000002
This created a full user process dump and it put the location of the user dumps in the C:\Dumps folder.
Then once we had the user dump we took a look at the stack trace of the corrupting shutdown thread inside of WINDBG:
0:000> k
ChildEBP RetAddr
0013f714 77476a04 ntdll!KiFastSystemCallRet
0013f718 75656a36 ntdll!NtWaitForMultipleObjects+0xc
0013f7b4 75dfbd1e KERNELBASE!WaitForMultipleObjectsEx+0x100
0013f7fc 75dfbd8c kernel32!WaitForMultipleObjectsExImplementation+0xe0
0013f818 75e105df kernel32!WaitForMultipleObjects+0x18
0013f884 75e1087a kernel32!WerpReportFaultInternal+0x186
0013f898 75e10828 kernel32!WerpReportFault+0x70
0013f8a8 75e107a3 kernel32!BasepReportFault+0x20
0013f934 774a7f02 kernel32!UnhandledExceptionFilter+0x1af
0013f93c 7744e324 ntdll!__RtlUserThreadStart+0x62
0013f950 7744e1b4 ntdll!_EH4_CallFilterFunc+0x12
0013f978 77477199 ntdll!_except_handler4+0x8e
0013f99c 7747716b ntdll!ExecuteHandler2+0x26
0013f9c0 7744f98f ntdll!ExecuteHandler+0x24
0013fa4c 77476ff7 ntdll!RtlDispatchException+0x127
0013fa4c 5483ccd4 ntdll!KiUserExceptionDispatcher+0xf
WARNING: Frame IP not in any known module. Following frames may be wrong.
0013fd60 7748d690 <Unloaded_PseudoServerInproc.dll>+0xccd4
0013fd7c 7748e3d9 ntdll!RtlProcessFlsData+0x57
0013fe14 7748e12f ntdll!LdrShutdownProcess+0xbd
0013fe28 75e0bbd6 ntdll!RtlExitUserProcess+0x74
0013fe3c 775836dc kernel32!ExitProcessStub+0x12
0013fe48 77583371 msvcrt!__crtExitProcess+0x17
0013fe80 775836bb msvcrt!doexit+0xac
0013fe94 0103129e msvcrt!exit+0x11
0013ff1c 75dfed4c iexplore!__wmainCRTStartup+0x164
0013ff28 7749377b kernel32!BaseThreadInitThunk+0xe
0013ff68 7749374e ntdll!__RtlUserThreadStart+0x70
0013ff80 00000000 ntdll!_RtlUserThreadStart+0x1b
There was this external DLL (not part of the standard Windows build) that was loaded into the stack and ad appeared to be partially or fully unloaded by the time that WER could capture the exception. We wanted to see if this DLL was being injected by way of AppInit_DLLs key. At the time, we did not know what this particular DLL was part of. All we knew was PseudoServerInproc.dll appears to be an unknown DLL that was injected into the IE process
We went to AppInits_DLL in the registry and found the MFAHook which is a commonly known master hook DLL used in Citrix products. We disengaged all DLLS in that Key by using the following .REG file:
Windows Registry Editor Version 5.00
[HKEY_LOCAL_MACHINE\SOFTWARE\Microsoft\Windows NT\CurrentVersion\Windows]
"LoadAppInit_DLLs"=dword:00000000”
The issue immediately went away. Now that we knew it was tied to one of ythe Citrix products being leveraged on the machine, we went back to the AppInit_DLL key to examine MFAHook. This will require us going further to investigate which specific hook DLL is the issue. We know the DLL was PseudoServerInproc.dll
So we went into the Citrix configuration to get all of the specific hook agents and the processes they inject into and found our DLL under the following registry key:
Key: HKEY_LOCAL_MACHINE\SOFTWARE\Citrix\CtxHook\AppInit_Dlls\HDXMediaStreamForFlash
Value: FilePathName
Data: C:\\Program Files\\Citrix\\ICAService\\PseudoServerInproc.dll
A subkey denotes the exe's it hooks into:
HKEY_LOCAL_MACHINE\SOFTWARE\Citrix\CtxHook\AppInit_Dlls\HDXMediaStreamForFlash\iexplore.exe
We found that by deleting it – this also fixed the issue. Upon further investigation with Citrix, we found that this was related to a known issue with one of there products from their VDI suite - AND - they already had a fix for this issue (which worked like a champ!~)
More info here:
https://forums.citrix.com/thread.jspa?threadID=307236&tstart=0
On a side note, if you want to use a more extensive tool for collecting these kind of crashes for analysis, I would highly encourage you to download ProcDump and configure it to be your default application experience debugger. You can enable it by importing the following .REG file:
Windows Registry Editor Version 5.00
[HKEY_LOCAL_MACHINE\SOFTWARE\Microsoft\Windows NT\CurrentVersion\AeDebug]
"Auto"="1"
"Debugger"="C:\\procdump\\procdump.exe /accepteula -ma %ld C:\\Dumps"
"UserDebuggerHotKey"=dword:00000000
[HKEY_LOCAL_MACHINE\SOFTWARE\WoW6432Node\Microsoft\Windows NT\CurrentVersion\AeDebug]
"Auto"="1"
"Debugger"="C:\\procdump\\procdump.exe /accepteula -ma %ld C:\\Dumps"
"UserDebuggerHotKey"=dword:00000000
[HKEY_LOCAL_MACHINE\SOFTWARE\Microsoft\.NETFramework\DbgManagedDebugger]
"Auto"="1"
"Debugger"="C:\\procdump\\procdump.exe /accepteula -ma %ld C:\\Dumps"
"UserDebuggerHotKey"=dword:00000000
[HKEY_LOCAL_MACHINE\SOFTWARE\Wow6432Node\Microsoft\.NETFramework\DbgManagedDebugger]
"Auto"="1"
"Debugger"="C:\\procdump\\procdump.exe /accepteula -ma %ld C:\\Dumps"
"UserDebuggerHotKey"=dword:00000000
This will register Procdump as the default post-mortem debugger instead of WER. It will intercept the exception and will store a dump file in the specified folder.