How to use OMS to analyze NTLM traffic logged in netlogon.log
Recently a customer asked me whether we can analyze the netlogon.log file with log analytic capabilities of OMS (Operations Management Suite).
In the past, they needed to use different tools and scripts to get the information they need.
For example "What accounts are still using NTLM very frequently, and from which computer?"
In this post, I want to show how easy it is to use OMS to get those information in near real time, instead of running a bunch of scripts and tools manually on demand.
At the end you will see, you can use this method to filter and analyze not only for NTLM traffic. OMS search capabilities will give you much more information in one single dashboard.
Hint: Before starting here, please observe your data volume that your netlogon logging generates.
For details how to enable and configure netlogon logging please check out here.
https://support.microsoft.com/en-us/help/109626/enabling-debug-logging-for-the-netlogon-service
Depending on your environment and your setting which data gets logged into netlogon.log there might be 100 MB / DC or more per day.
There are two main steps necessary.
1. Collection netlogon.log from all DCs using Microsoft Monitoring Agent / OMS
2. Extract the important fields out of the collected data
Let's start collecting the netlogon.log file from your DCs.
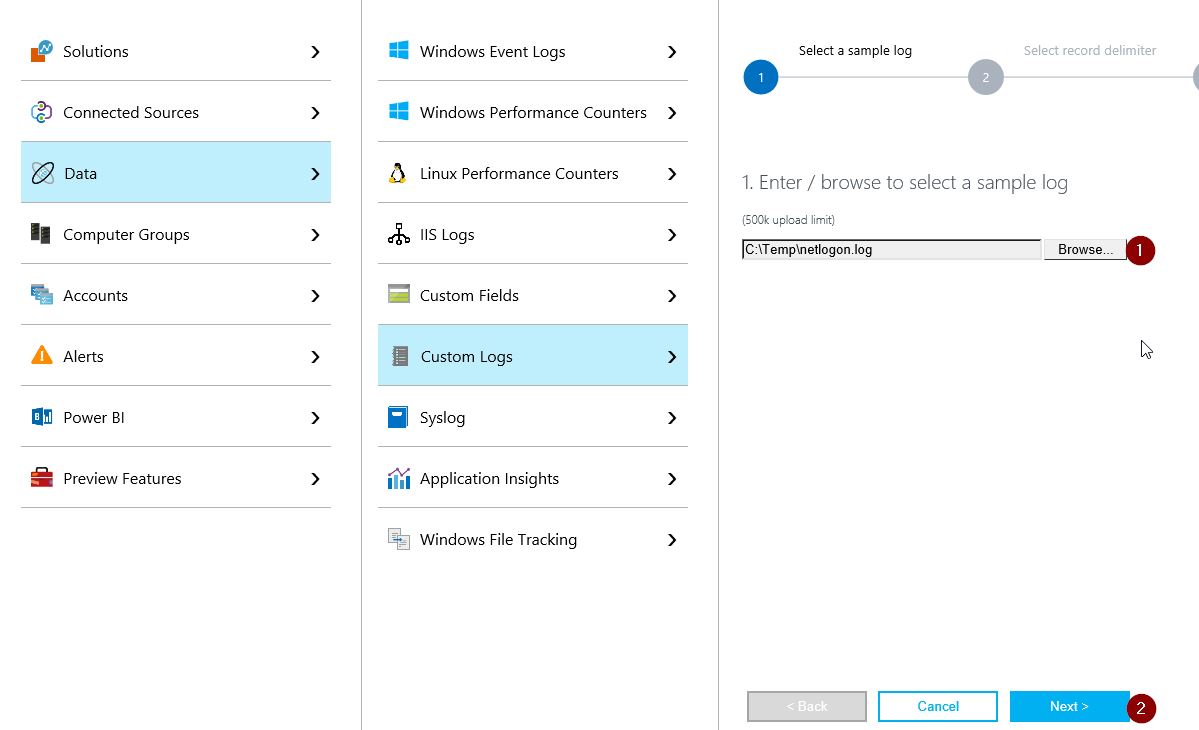
In your OMS Workspace, you need to enable Custom Logs collection.
First of all you need to upload one sample netlogon.log file to OMS. This will give OMS the correct file structure.
Hint: If your file size is more than 500k please reduce the file size before uploading it.
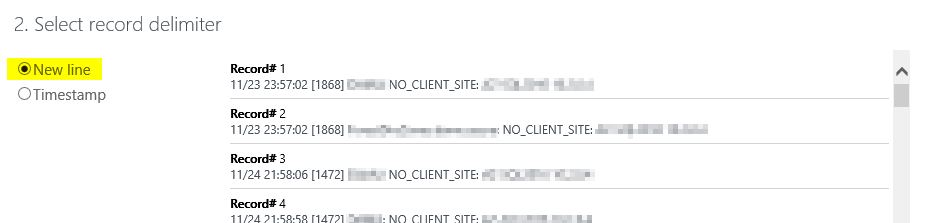
Now we need to specify the line indicator. In this case, we need to select "New line", because each line should be a new record in OMS.
Note: For other log file you might use "Timestamp", but netlogon.log has no year in the timestamp, so no currently available pattern matches here.
Right now, we need to define where the netlogon.log file is located on your DCs.
By default this is under c:\Windows\debug\netlogon.log 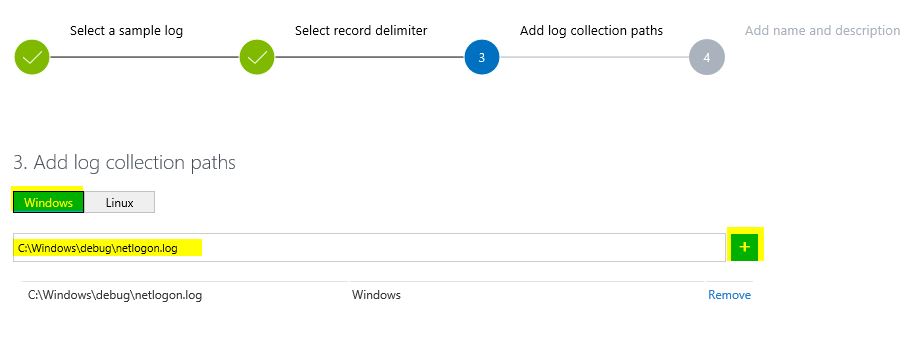
At a last step, we need to define the data type name of all collected netlogon records in OMS.
I used "NetLogon_CL" in this demo.
HINT: If you use all self-defined names exactly (case sensitive) like I do here, you can use the dashboard I've provided at the end of this post. 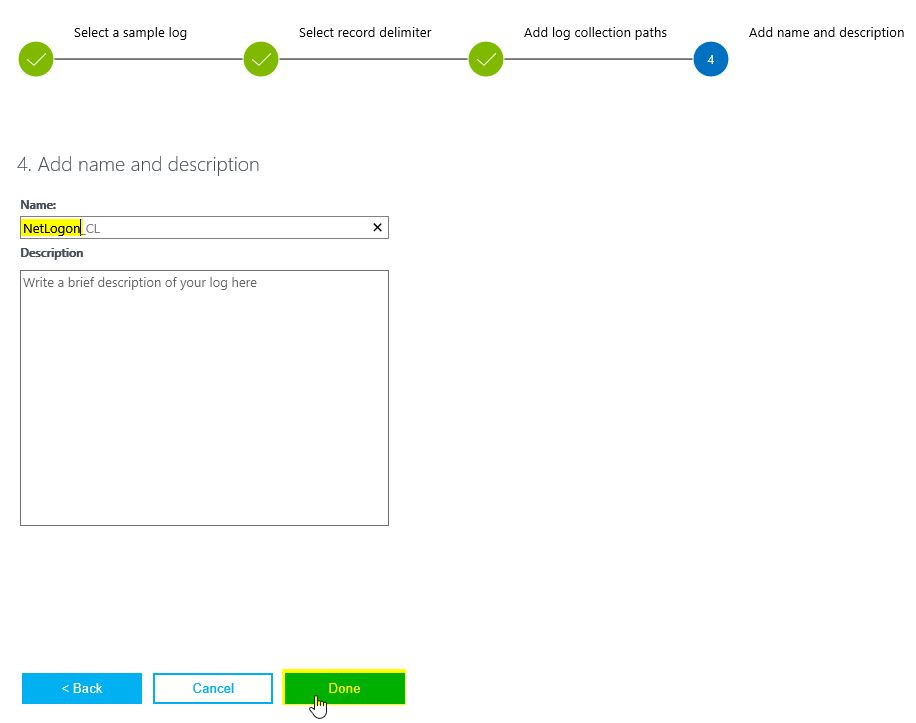
Once the definition is done, the MMA (Microsoft Monitoring Agent) will download the new config and start uploading the netlogon.log data to your OMS workspace
As soon as we see record flowing into, we can start with extracting specific data out of the raw data records.
Now: Let's start extracting some data.
What we need to do, is to extract any data we want to analyze and filter in our dashboard.
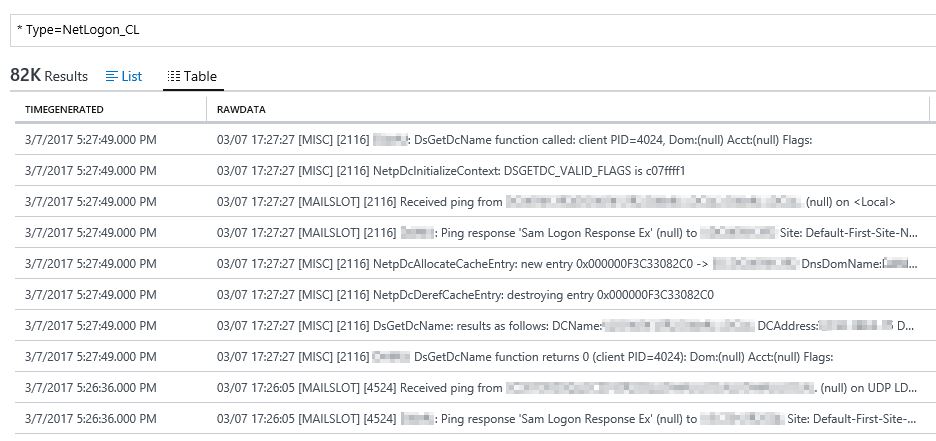
Filter our OMS data by using the following query: * Type=NetLogon_CL
(Note: if case you called your data type differently, you need to search for your data type name of course) ;-)
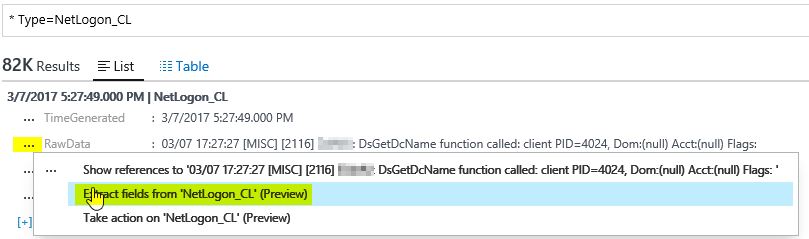
Select any record in your record list, and click in the " ... " selector and choose "Extract fields from 'NetLogon_CL' "
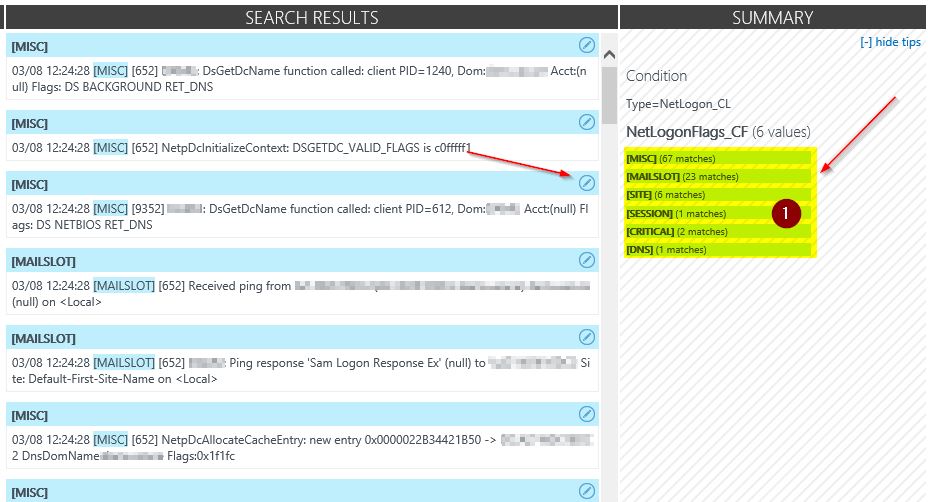
In the extraction window, please mark the string you want to extract. I startet with the netlogon flags described here.
The reason for that is, to be able to filter for specific records from specific areas in the log file.
As before we need to define a name for this field. I called it "NetLogonFlag_CF". Once again choose whatever you prefer.
If you follow exactly my naming proposal you can use my dashboards at the end of the post.
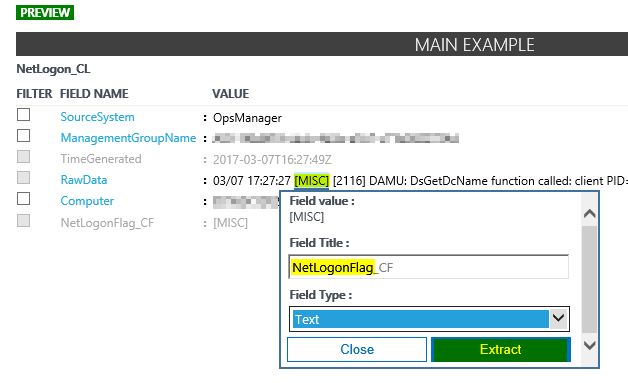
After you click "Extract" you should see in the summary field a similar output. This represents a preview of your selection on your real data records in OMS.
In case there are any strange values you can correct the selection or modify it in the middle pane.
Hint: Sometimes you might need more than one try to select the correct string. :-)
If the summary fits your expectations, click "Save extraction" and look for the results.
Every new record flowing into OMS will now be extracted by this pattern.
When you move to the search pane, and query for " * Type=NetLogon_CL" you should see different attributes on your new records.
Now, please repeat the previous extraction steps for the account string, "from" computer name string and "via" computer name string
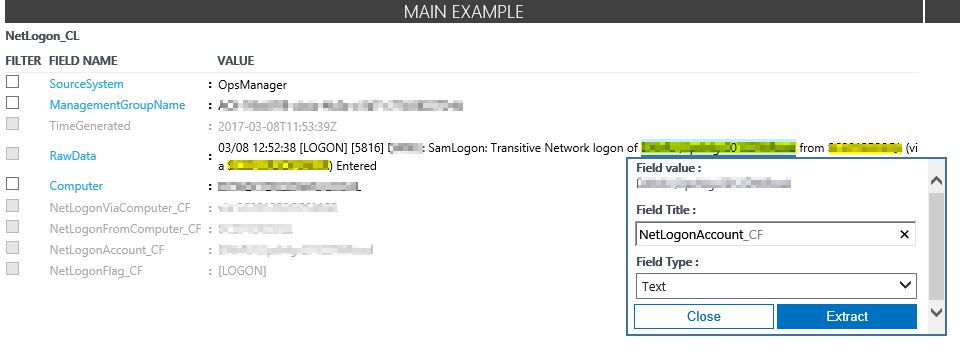
Extraction field names I used are:
NetLogonAccount_CF, NetLogonFromComputer_CF and NetLogonViaComputer_CF
All of them are used in my dashboard with these names.
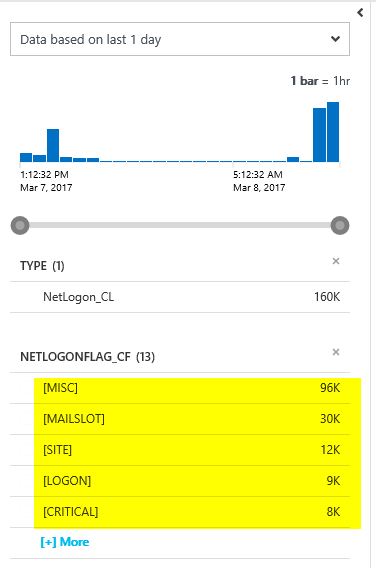
If you have extracted all those fields you should be able to see and use them in your OMS search as separate fields.
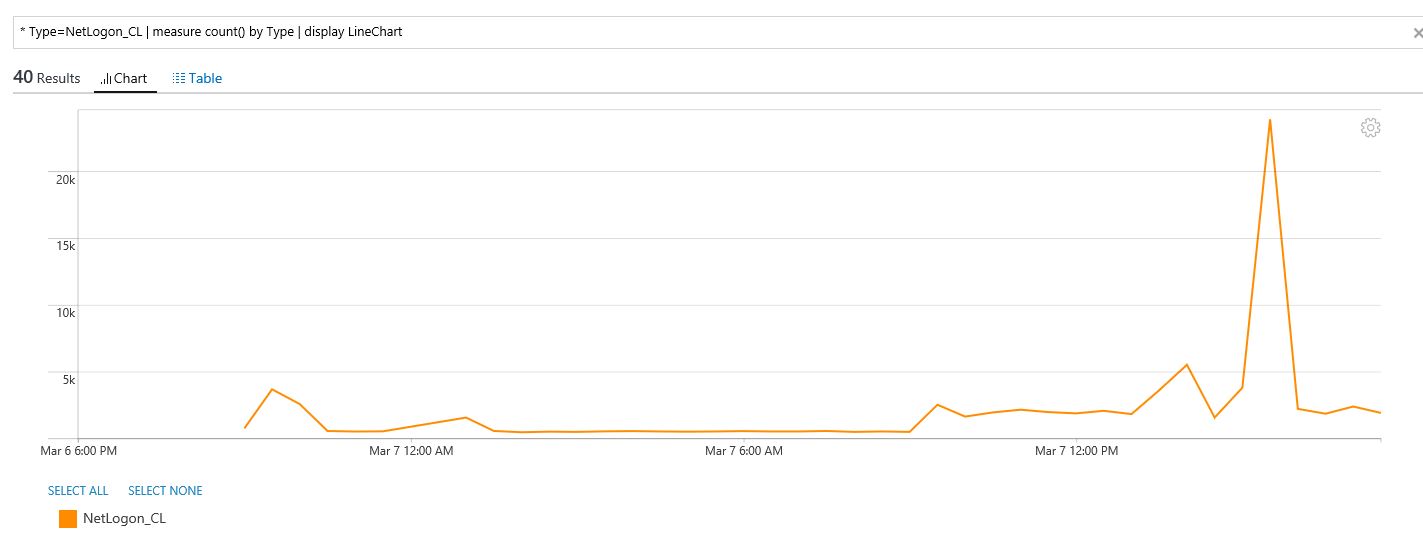
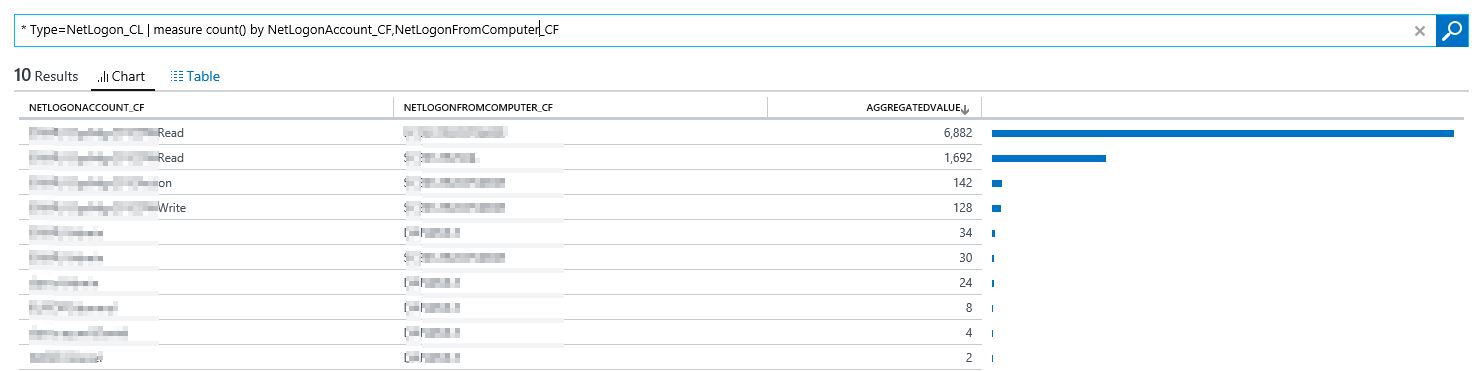
Try the following OMS query: " * Type=NetLogon_CL | measure count() by NetLogonAccount_CF,NetLogonFromComputer_CF"
There you can see all accounts using NTLM and you know in near real time where they come from.
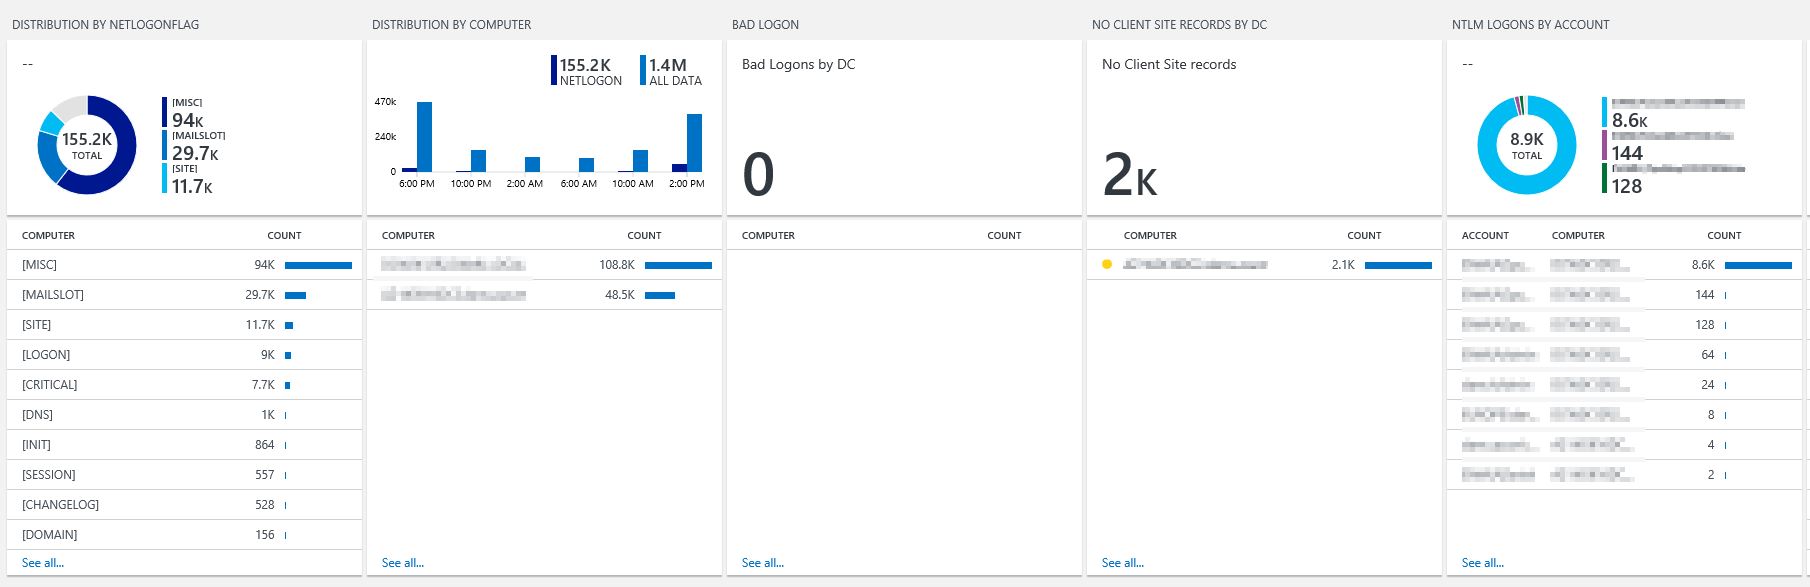
Additionally, you can build you own dashboard or download my dashboard here: OMSNetLogonDashboard 
Have Fun!
Daniel
Disclaimer: As always there no warranty, please test this in your test environment before using it in your productive environment.