Example Management Pack: Monitor SCOM alert history
Monitorining SCOM alert history? Why should I do that? That's what I thought some until recently. At one of my customers a colleague discovered a strange behaviour with one alert. Opening this alert in the SCOM console took about 10+ minutes!!! WHAT? WHY?
Analyzing this alert a bit deeper, we found out that this specific alert had 83.000 (!!!) history records attached. That explains why the SCOM console took forever opening this alert...
Background information
First of all:
What is a high history count?
10 entries? 100? 1000? As always: It depends. I have made some completely non-scientific and not representative tests and you should not have any issues with 100 history entries. But if you have 10.000 open alerts with each having 100 histroy entries... I think you get the picture.
What causes an alert history entry?
Each modification of an alert will cause an entry: "<Date> Modified by <User>". Additionally you can add of course manual entries for providing comments on this alert.
What can cause so many alert history entries?
IMHO this is most likely caused by some kind of automation tool. You cannot create so many entries manually. In the case of my customer they are using a custom Orchestrator runbook which modifies SCOM alerts and therefore writes an entry into the alert history for each modification.
Where are alert history entries stored?
All history information is only stored in the Operations Manager database in the table dbo.AlertHistory. The information in this table will not be transfered into the Data Warehouse.
The most important columns in the table are
- AlertHistoryID (the primary key)
- AlertID (foreign key for creating a relationship between the alert and its history)
The Management Pack
To monitor if an alert gets more than X history entries I created a 3 state script based monitor:
- targeted at the Root Management Server Emulator class
I picked this class because it is always there, and I can be sure, that the computer account has at least read rights on the OperationsManager database - executing a PowerShell script which collects information directly from the database (Kudos to my fellow SQL colleague Cornel Sukalla)
- The monitoring states are:
- Healthy -> all is well
- Warning -> there is an issue retreiving the data
- Error -> one or more OPEN alerts exists with more than X history entries
- It creates an actionable alert with all alert IDs having more than X history entries
- the monitor is configurable with two main overrides
- IntervalSeconds -> Frequency
- MaxHistoryCountThreshold -> 20 (default value)
The monitor checks only OPEN alerts (ResolutionState < 249), because you can only modify open alerts.
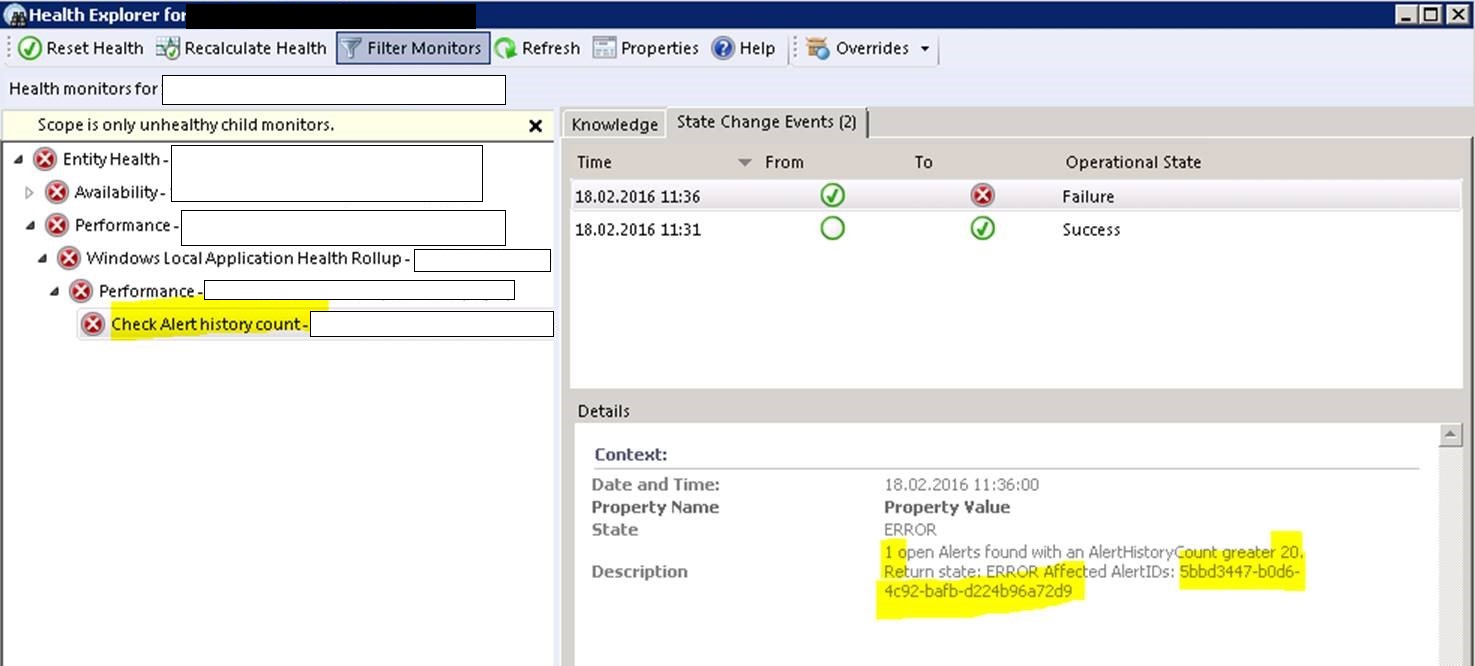
The monitor in action in state view:
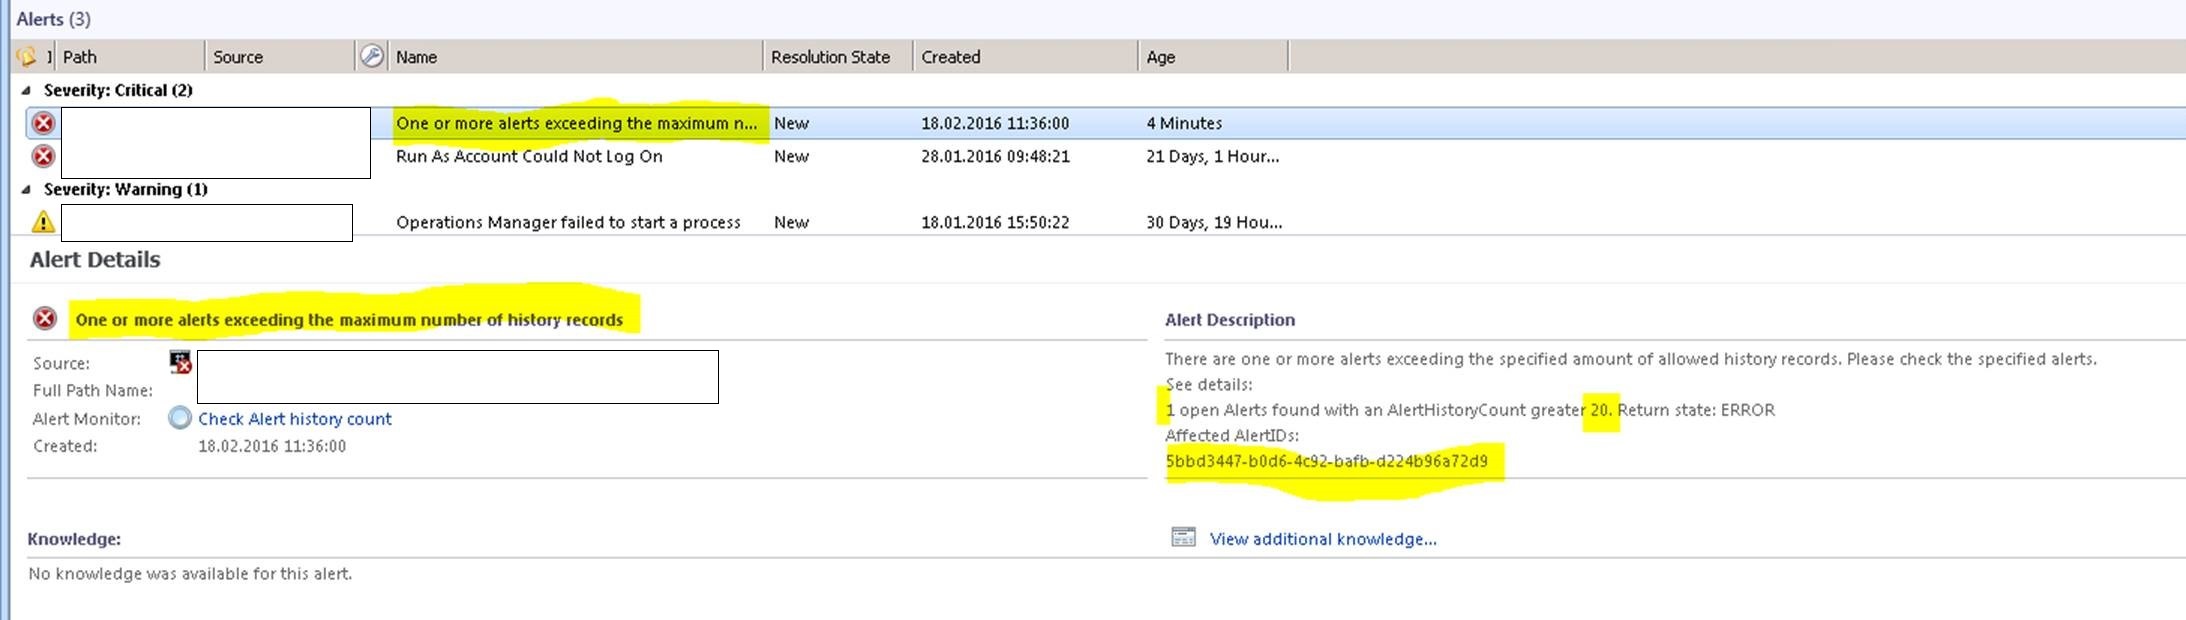
And the corresponding alert:
Please find the sample Management Pack in Technet Gallery .