Using Time Intelligence for Dynamic Filters with Service Manager 2012 OLAP Cubes - Part 1
This will be a series of posts in reference to using Time Intelligence with Service Manager 2012.
Configuring the Filters
The OLAP Cubes for Service Manager make for very powerful tools for reporting and pulling data. In a previous post on the ServiceManager Blog it was described how to Slice Incidents by Days, Months and Quarters. This same can be used for Any other Work Item, like Service Requests, Activities, Problems, Change Requests, etc. By using the Time Slicers are you able to leverage Time Intelligence filters in PerformancePoint to make dynamic filters. To do this you must first configure Performance Point on a SharePoint Server which is out of scope for this blog post but can be found here.
Since the first 3 steps have been discussed in great detail on the Service Manager blog I will just link to them below for the information.
- Configure a Role Playing Dimension as described in the ServiceManager Blog
- Configure the Month ordering as described in the post titled Month Ordering by Calendar Sequence when Slicing Measures by CalendarMonth.
- Configure PerformancePoint as described in the post How to Make SharePoint PerformancePoint Dashboards Using SCSM DW Cubes
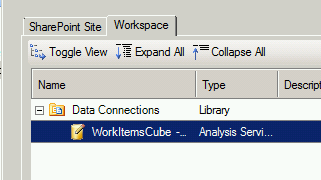
- Once The above 3 steps are configured it is time to configure your data source, to do this launch Dashboard Designer from your BI site that you created.
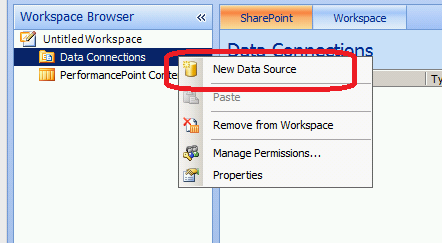
- Right click Data Connections and choose New Data Source
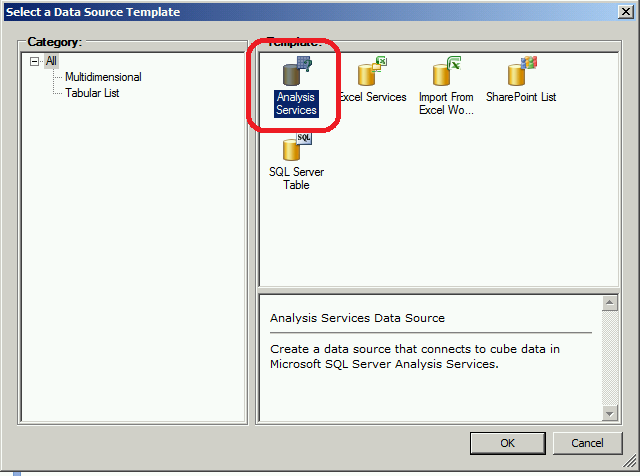
6. Choose Analysis Services as your Data Source and click OK.
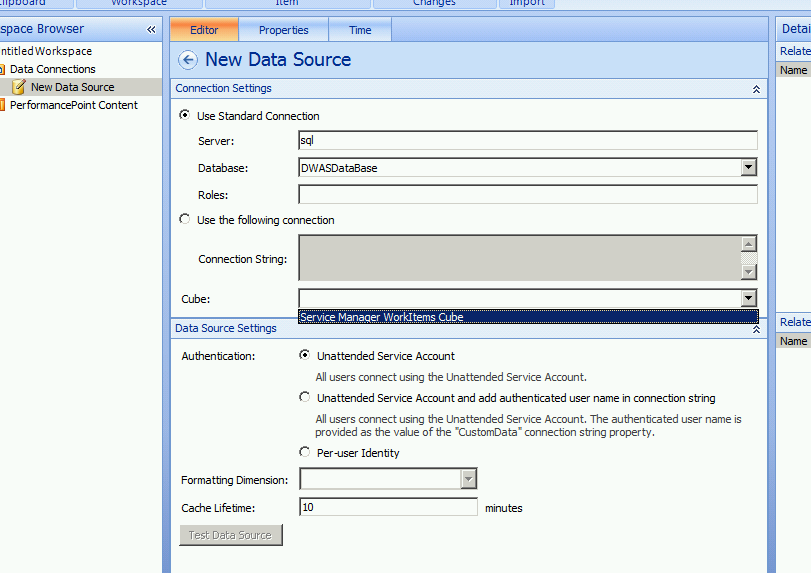
7. When the Connection Settings section appears, enter your SQL Server name in Server (include instance if using a named instance), choose DWASDatabase for the Database and for Cube, choose the cube that will be the data source..
** It is important to note only one Role Playing Dimension can be used to slice time per data source, if you want to have a Created Date and a Resolved Date time slicer you will have to create 2 data sources for the same Cube. **
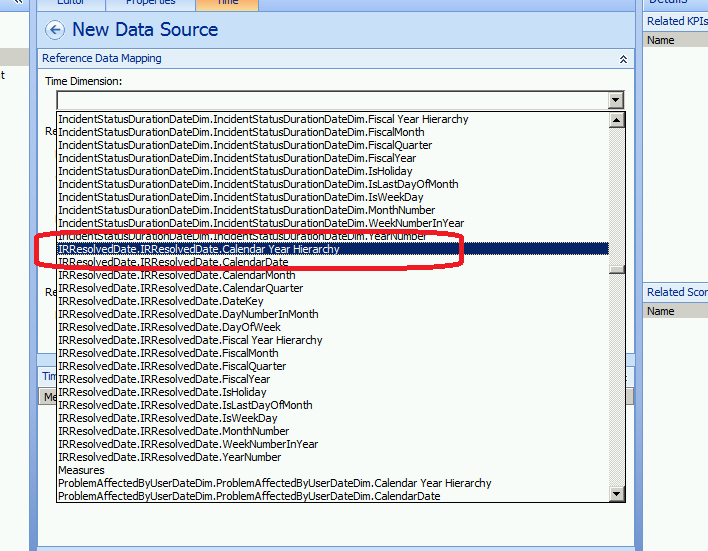
8. Next we are going to choose the Role Playing Date Dimension to slice our data with. For this we want to use a Hierarchal Date Dimension as this will allow for many different ways to slice our data. For the purpose of this post we will use the Role Playing Dimension IRResolvedDate which was created by me using the instructions found in the links above. I will describe in a later post the reason why I choose Resolved Date over Created date for my time slicing as this is a whole other topic.
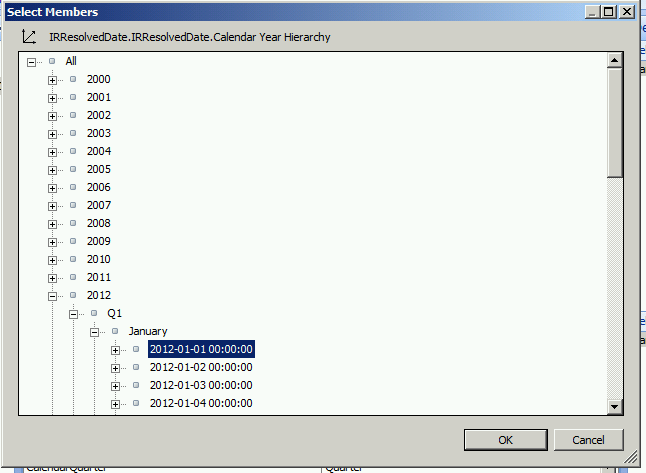
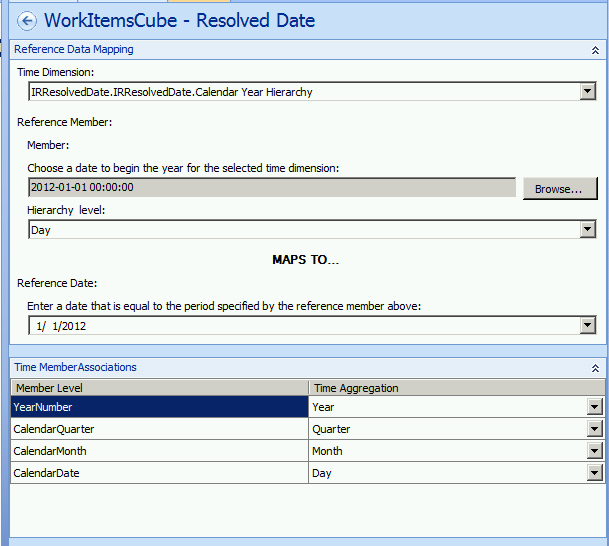
9. Once you have picked the Time Dimension we need to fill out the remaining information. Under the Reference Member section choose Member. This is where we are going to define where our year begins for Time Intelligence. It is important to note that since we are using a hierarchy you can choose and member, and based on your choice you will be able to slice data differently. If you choose a Year, you can only slice by year, if you choose a quarter you can slice by quarter and year.. this continues all the way down to day. Since I want to be able to slice by day I am going to choose 2012-01-01 00:00:00.
10. Next we are going to choose the Hierarchy level of Day, and for the reference day we will use the same day as we chose for the member above. Finally for the Time Aggregations we will map them to their corresponding Member Levels.
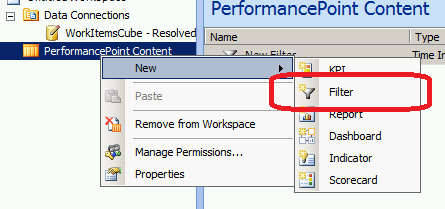
11. We are now done with our data source and can create our Filter. Right click on PerformancePoint Content click New and Filter.
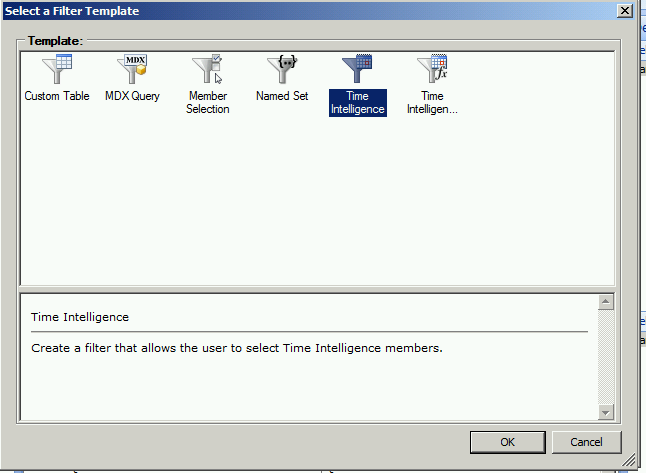
12. For the Filter Template we will use Time Intelligence and click OK. (I will write another blog post to talk about the other filters)
13. Choose Add Data Source and choose the Data Source we created earlier and click OK and click Next.
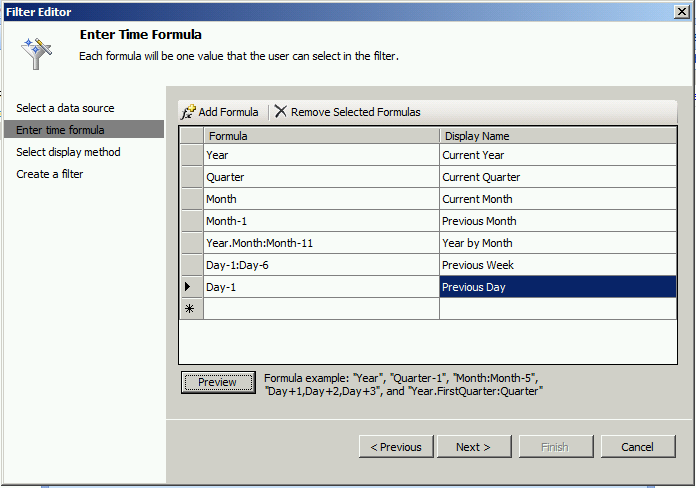
14. Here is where we get to get dynamic. We can use Time Intelligence formulas to provide to the user to make the dashboard dynamic. Below are some filter options that I setup. You can go to https://office.microsoft.com/en-us/performancepoint-server/about-syntax-for-time-intelligence-expressions-HA010241138.aspx for more information on syntax for Time Intelligence Filters. Once you have configured your filters you can click Next. To test your filter you can click Preview and it will show you the date ranges in your hierarchy that would be used to filter the data, if you receive any error that means there is something configured incorrectly.
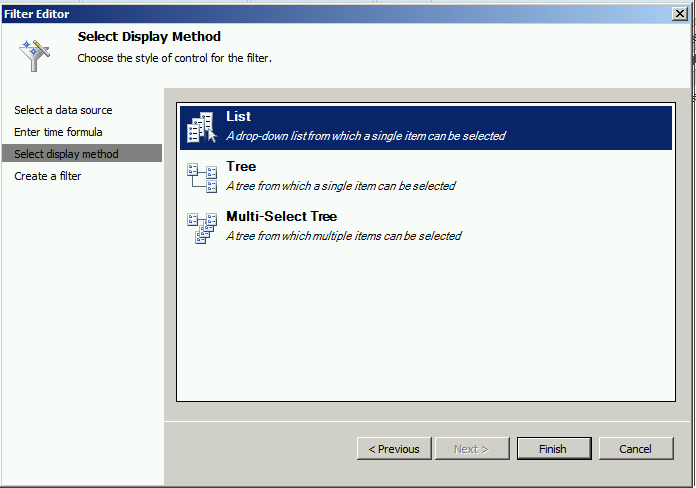
15. Finally choose how you want to display the filter to the user and choose Next. For the sake of this demonstration I used List, but Tree and Multi-Select Tree can be used as well. Multi-Select tree can help Aggregate data even further and can be a topic for another post.
Now we have a Data Source and a Filter for our data the next step is to create the KPI's, Score Cards and Dashboard that we will apply our filter to, to create our Dynamic Dashboard. Next up Using Time Intelligence for Dynamic Filters with Service Manager 2012 OLAP Cubes - Part 2