System Center 2012 R2 Configuration Manager - Software Update Groups Dashboard
Please review my previous blogs that led up to this dashboard:
I’ve received many requests for a software update compliance dashboard based on Software Update Groups and Collections since not everyone reports compliance based on Operating System or has a whitelist\blacklist of updates.
This Software Update Groups Dashboard displays the compliance for each Software Update Groups. The intention of this dashboard is to be displayed on a single screen and able to be printed on a 8” x 11” paper in landscape with no margins. If you have more than 10 SUGs the chart will expand onto the next page.
Breaking down each SUG in a format similar to my previous blog (Month to month, etc) is very time consuming so it’s not included in this version of the dashboard. I do plan on having additional sub reports in the future so stay tuned for those.
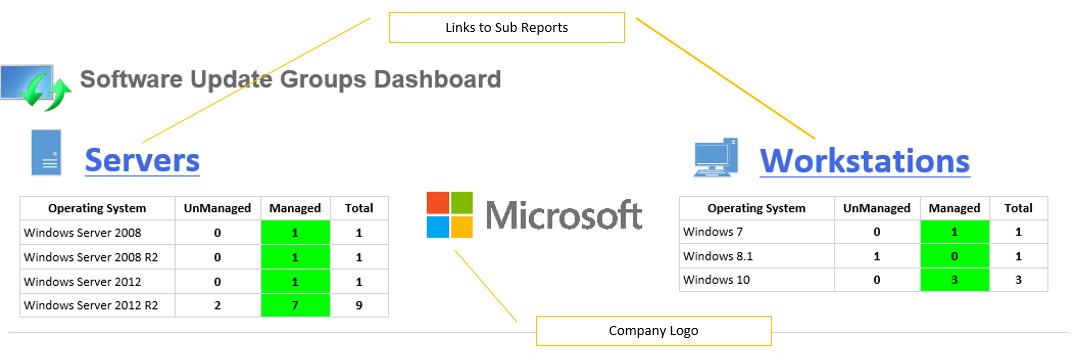
Similar to my previous dashboard the top displays the assets. A managed system is defined as a non-obsolete system that has performed a successful scan within a period of time. That time is defined in the @DaysScanned parameter with a default of 14 (days). Feel free to change this. Unlike my previous blog, the chart doesn’t distinguish between an unmanaged or managed system as the queries are using the built in views and the results are based off of a SUG and collection. You are in control of what system and software update to report on.
The bottom half is the SUG compliance chart. It displays the same information that can be found in the console by clicking on a SUG and looking at the bottom right hand corner under Statistics. It will be displayed in a small Pie chart. By default the collection the chart uses is the All System collection. This can be changed by modifying the default value in the CollectionID parameter.
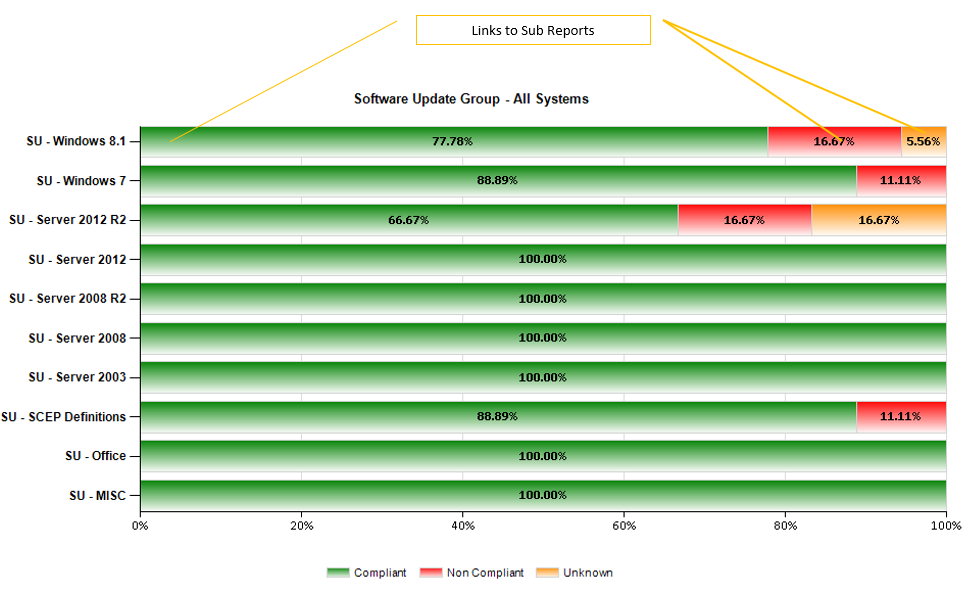
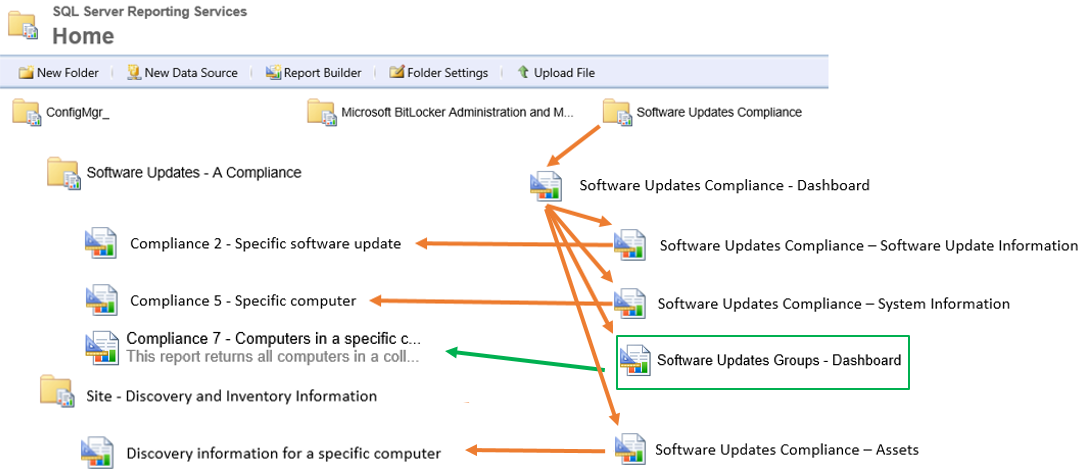
Each Series in the chart is clickable and will open the Compliance 7 - Computers in a specific compliance state for an update group (secondary) report with the parameters prepopulated.
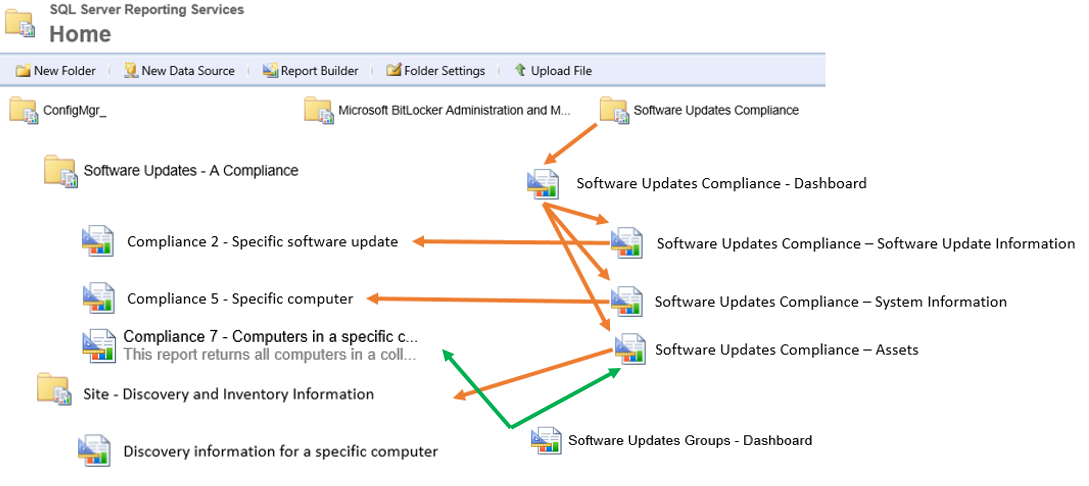
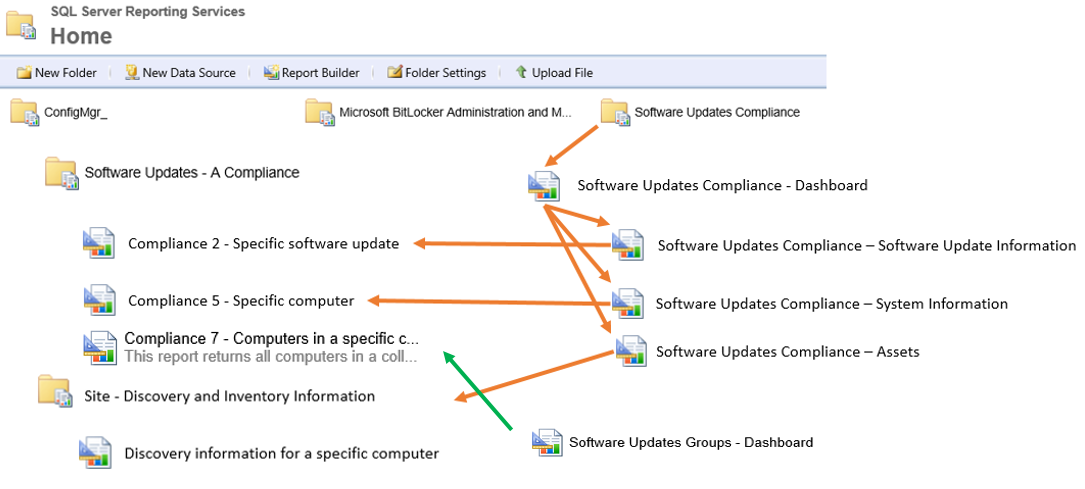
The green arrow indicates the path in which the sub report is linked. The orange arrows show the patch that sub reports are linked from my previous blog.
Attached to this blog is a zip file containing the reports from the Software Updates Compliance dashboard and the Software Update Groups dashboard. Please use the instructions on my Software Updates Compliance blog on how to upload and modify those reports to work.
To install the Software Update Groups dashboard, similar to the previous reports upload the Software Updates Groups - Dashboard.rdl file to the Software Updates Compliance folder . Open theSoftware Updates Groups - Dashboard.rdl with ReportBuilder (or Visual Studio) and change the datasource for your Configuration Manager server.
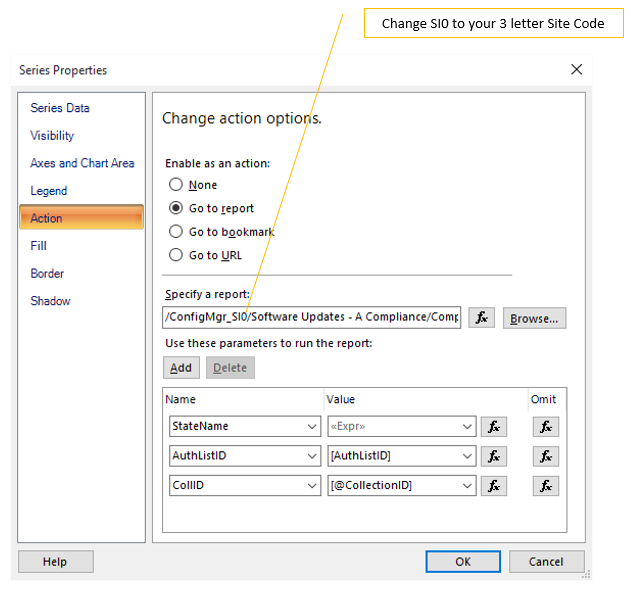
For each series (Green, Red, and Orange) in the chart, right click it and select Series Properties. Click Action then change the link to the report to include your site code.
Updated on 9-23-2015
- Changed the charts Dynamic Height to =(Count(Fields!Title.Value, "SUG_Status") /2) & " in"
- Changed the Title Property Auto Increment value to 1
- Incremented Version to 1.1