System Center 2012 R2 Configuration Manager - Software Update Groups Compliance Dashboard
Taking the concept of the Software Updates Compliance Dashboard in my previous blog, the Software Update Groups (SUG) Compliance Dashboard (I’m running out of names for these dashboards) is designed to show applicable software updates status while working with the Configuration Manager SUG and collections.
Unlike the previous dashboard which looks at all updates per operating system, this dashboard is more useful for organizations that use a whitelist\blacklist or baseline of updates to collections that they may not necessarily control.
This dashboard has many layers of “filters”. Only updates that are applicable to managed systems in a specified collection and are contained in a specified SUG that fall into certain Categories will be reported on.
Here is how it works. Each report has a set or parameters. The parameters define what will be filtered on. Only managed systems will be included at since it is very common to have outdated information in a Configuration Manager database.
There are five different types of filters:
- Days Scanned
- This parameter determines what systems will be included in the reports. Only non-obsolete systems that have performed a successful scan within the last @DaysScanned (default is set to 14 days) will be reported on.
- SUG
- Only updates that are contained in the SUG are reported on.
- Collection
- Only updates that are applicable to the systems in the collection will be reported on.
- Category
- Only updates matching the category will be reported on.
- Date\Time
- Start Date (only applies to the SUG Compliance – Dashboard)
- Only updates that have been released or revised before the Start Date and within a 12 month period of the Start Date will be reported on.
- Start Date and End Date (only applies to the SUG Compliance – Software Update Information report)
- Only updates that have been released or revised between the dates will be reported on.
- Start Date (only applies to the SUG Compliance – Dashboard)
Be aware that any update in the selected SUG that doesn’t apply to a system in the selected collection will not be reported on.
Using the Dashboard
When you first run the dashboard you will need to select the parameters to run the report.
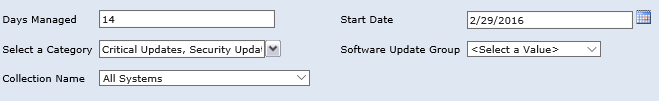
After selecting the parameters click the View Report button and the dashboard will appear. The dashboard contains a table listing the operating systems in the selected collection, a chart depicting systems missing a certain number of updates, and a chart showing the applicable updates on a monthly basis over a period of 12 months. The last month is controlled by the @StartDate parameter.
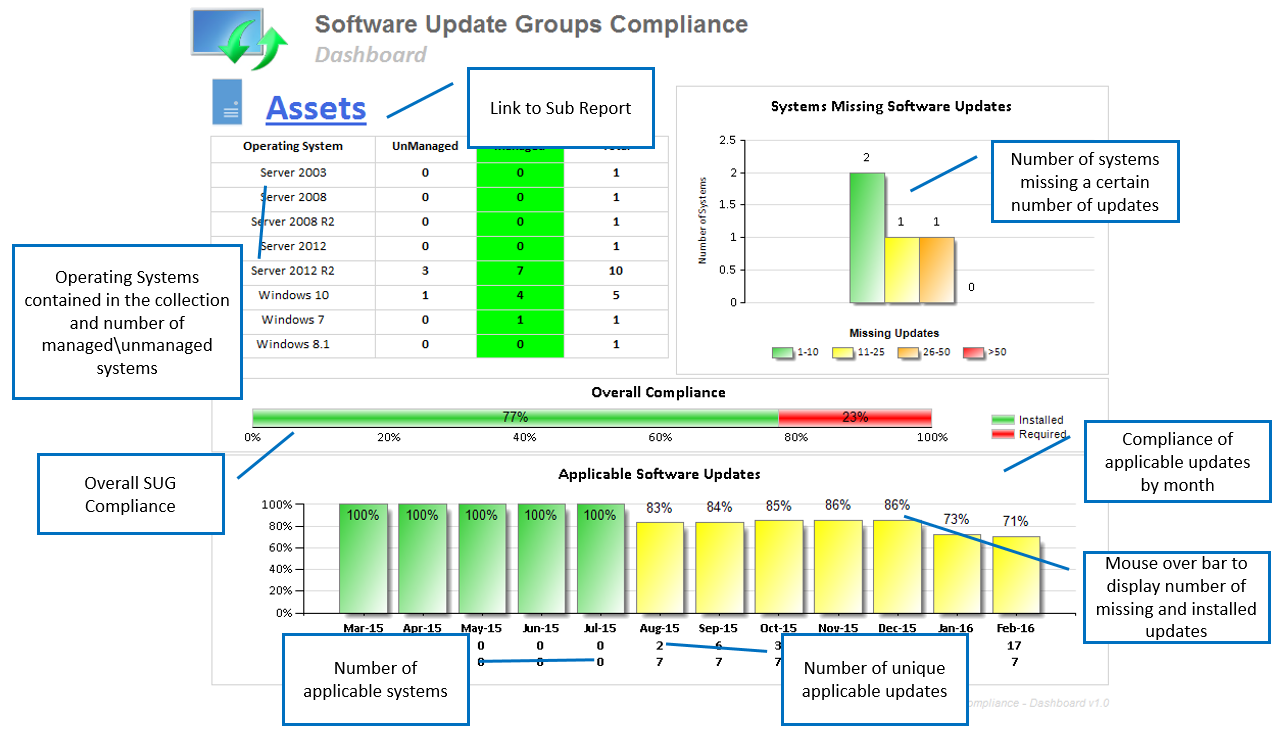
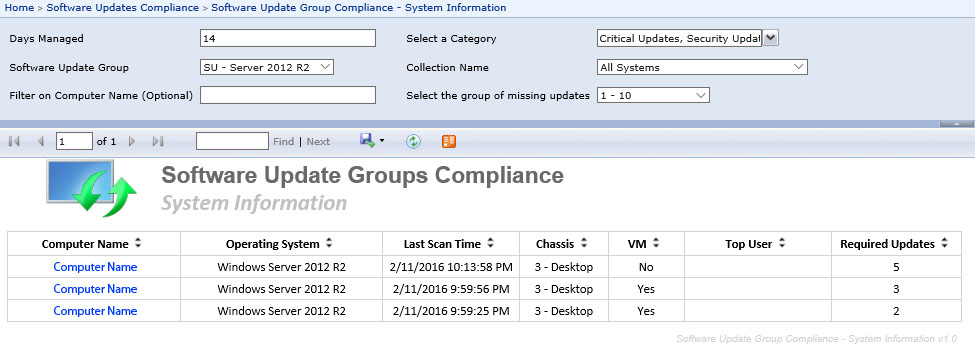
Assets
The Assets table list all operating systems detected in the specified collection as well as the number of managed or unmanaged systems. Remember that all results returned by the reports are based on managed systems.
You can click on the Assets link to be redirected to a sub report which will show information on the assets.
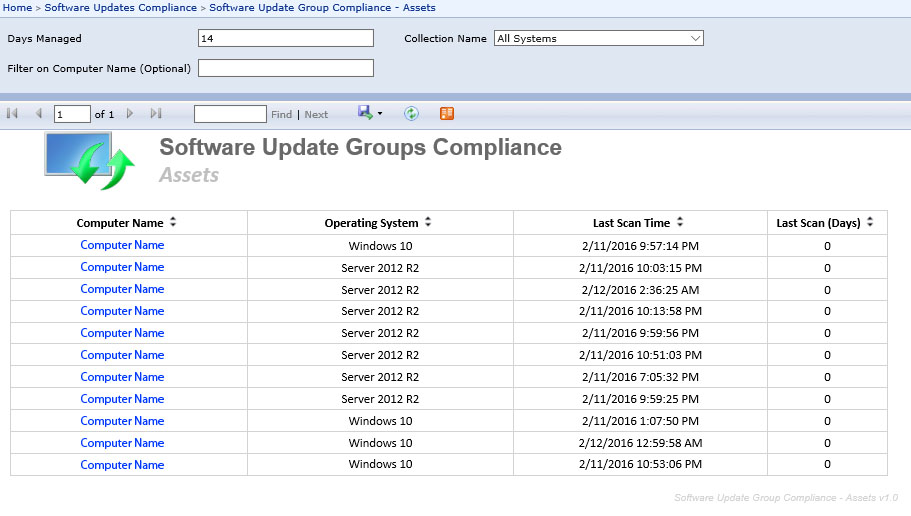
Each computer name is a link to the built-in Discovery information for a specific computer report.
Systems Missing Software Updates
The Systems Missing Software Updates chart groups systems together depending on how many updates the they are missing. This perspective can add a spotlight to problematic systems that could be missed if only looking at a patch compliance level.
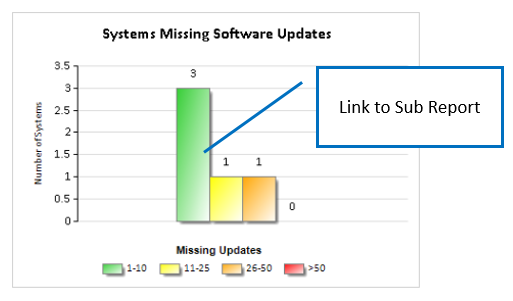
You can click each bar to be directed to a sub report that will list each system per group.
Each computer name is a link to the built in Compliance 5 - Specific computer report.
SUG Overall Compliance
The SUG Overall Compliance column chart displays the overall patch compliance for each applicable updates in the SUG. The column is clickable and will redirect you to the Compliance 1 - Overall compliance report.

Applicable Software Updates
The updates that meet the criteria previously describe are considered applicable and are display in the monthly chart.
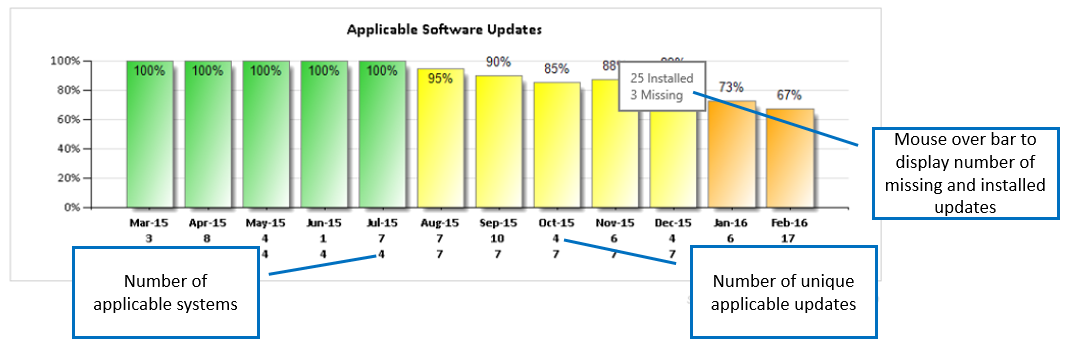
The bar’s color depicts the compliance level.
- Green – 100%
- Yellow – 66% - 99%
- Orange – 33% - 65%
- Red – 0% - 32%
Under each bar contains 2 numbers. The top number is the unique applicable updates that has been released or revised that month and the bottom number is the number of systems that are affected by the applicable updates.
You can mouse over each bar to display the tooltip. The tooltip will show the number of installed and missing updates. These numbers are used to get the compliance percentage for that month.
You can click each bar to be directed to a sub report that will list the applicable updates for that month.
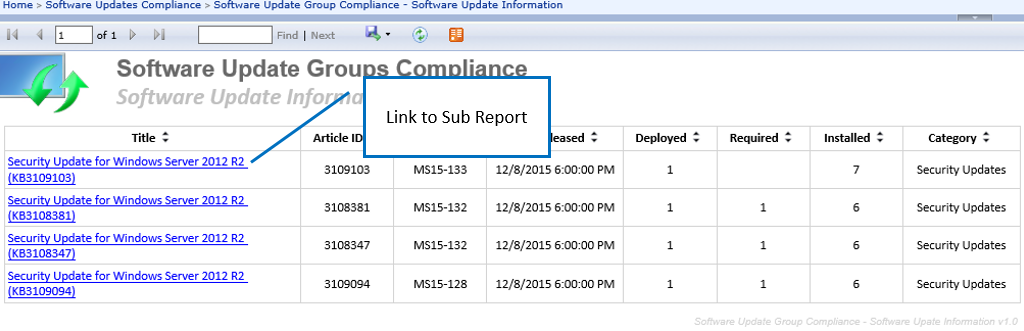
Each software update Title is a link to the built in Compliance 2 - Specific software update report.
Installing the Reports
The process of installing these reports is similar to my previous reports in past blogs.
I've attached a zip file containing the .rdl files to this blog. To install the dashboard, create a folder in the SSRS home page called Software Updates Compliance (If you installed my previous reports you should already have this folder) and place each .rdl file in it. Modify each report with your data source.
Change the site code in the Overall Compliance chart.
- Right click each series (green and red bar) then select properties
- Click Action
- Change the Site code to your Configuration Manager site code
- (e.g. change /ConfigMgr_SI0/Software Updates - A Compliance/Compliance 1 - Overall compliance to /ConfigMgr_LS1/Software Updates - A Compliance/Compliance 1 - Overall compliance)
For each sub report right click the text box with the hyperlink then select Text Box Properties. Perform the same steps as above to change the site code to your Configuration Manager site code.
Development
I have only tested this dashboard in my small lab. Please ensure the accuracy of the reports and watch for SQL performance when running them in your environment. Since I’m not able to use functions, stored procedures, external SQL tables, etc. the SQL queries are not as optimized as they could be.