Creating a Custom Report for System Center 2012 R2 Configuration Manager – Part 3
In Part 1 it was mentioned that the dashboard will accept
certain parameters. By default, SRS will list 2 parameters per line.
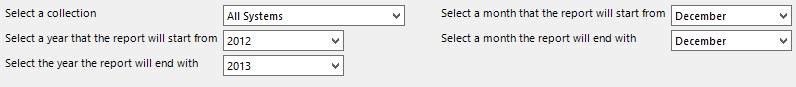
For the Collection parameter, the dashboard will display the collections name but will pass its Unique ID to the datasets in a variable called ColID.
To create this parameter, a dataset needs to be created. To create the dataset, a data source is required.
Creating the Data Source
- In the Report Data pane right click Data Sources--> Click Add Data Source
- The Data Source Properties window will appear
- Change the Name to CM
- Select Use a connection embedded in my report
- Select Microsoft SQL Server as the connection type
- Click the Build… button
- Enter the Server name to the SQL server
- Select the ConfigMgr database
- Click Test Connection to ensure that a connection could be established
- Click OK
- Click OK
Creating the All_Collections Data Set
- In the Report Data pane right click Datasets --> Click Add Dataset
- The Dataset Properties window will appear
- Change the Name to All_Collections
- Select Use a dataset embedded in my report
- Select the CM Data source
- In the Query box enter the following:
select distinct c.CollectionID, c.Name from v_Collection c order by c.Name - Click OK
Creating the ColID Parameter
- In the Report Data pane right click the Parameters folder --> Click Add Parameter.
- The Report Parameter Properties window will appear
- Change the Name to ColID (this is spelled colid)
- Change the prompt to Select a collection
- Click Available Values
- Select Get values from a query from the dataset
- Select CollectionID for the Value field
- Select Name for the Label field
- Click Default Values
- Select Specify values
- Click the Add button
- Enter SMS00001 for the Value
- This is the Collection ID for the All Systems collection.
- Click OK
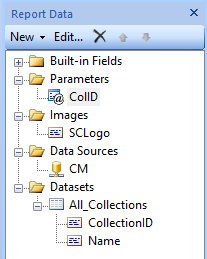
Your Report data pane should look like this:
Creating the other parameters
Month Parameters
Although it is possible to create datasets for the other parameters, this demonstration will use static entries.
- In the Report Data pane right click the
Parameters folder --> Click Add Parameter.
- The Report Parameter Properties window will appear
- Change the Name to StartMonth
- Change the prompt to Select a month that the report will start from
- Change the Data type to Integer
- Click Available Values
- Select Specify values
- Click the Add button 12 times
- Enter January for the Label and 1 for the Value
- Repeat this until you have December for the Label and 12 for the Value
- Click Default Values
- Select Specify values
- Click the Add button
- Click the fx button
- The Expression window will appear
- Enter =Month(today()) for the expression value
- This will get the number value of the month for day the report is run
- Click OK
- Click OK
Repeat these steps for the EndMonth parameter with the prompt of Select a month the report will end with
Year Parameters
Similar to the Month parameter the dashboard will create static year parameters with the starting year having a slight twist to its default value.
- In the Report Data pane right click the Parameters folder --> Click Add Parameter.
- The Report Parameter Properties window will appear
- Change the Name to StartYear
- Change the prompt to Select a year that the report will start from
- Change the Data type to Integer
- Click Available Values
- Select Specify values
- Click the Add button 10 times
- Enter 2004 for both the Label and Value
- Repeat this until you have 2014for both the Label and Value
- You may add or remove in more entries if you want to report update older or newer than 2004
- Click Default Values
- Select Specify values
- Click the Add button
- Click the fx button
- The Expression window will appear
- Enter =Year(today()) -1 to default the report to the year previous to when it is run
- Click OK
- Click OK
Repeat these steps for the EndYear parameter with the prompt of Select a year that the report will end with and a default value of =Year(today())
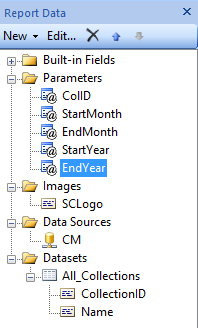
Your Report Data pane should now look like this:
Creating Other Datasets
- Similar to how the All_Collections dataset was created, create the All_OperatingSystems Dataset with the query of:
select distinct c.Name [Collection Name], gsos.Caption0 [Operating System], count(gsos.Caption0) [Number of Systems]
from v_R_System rs
JOIN v_FullCollectionMembership fcm on rs.ResourceID = fcm.ResourceID
JOIN v_Collection c on c.CollectionID = fcm.CollectionID
JOIN v_GS_OPERATING_SYSTEM gsos on gsos.ResourceID = fcm.ResourceID
WHERE c.CollectionID = @ColID
group by c.Name, fcm.collectionID, gsos.Caption0 - Create another Dataset called Collection_Details with the query of:
select distinct c.Name, count(rs.ResourceID) [Devices], (Select Count(LastScanTime) from v_UpdateScanStatus uss where datediff("d",LastScanTime, getdate()) <= 30) [Scanned last 30 Days],(Select Count(LastHWScan) from v_GS_WORKSTATION_STATUS gsws where datediff("d",LastHWScan, getdate()) <= 30) [Inventory last 30 Days]
from v_FullCollectionMembership fcm
JOIN v_Collection c on c.CollectionID = fcm.CollectionID
JOIN v_R_System rs on rs.ResourceID = fcm.ResourceID
LEFT JOIN v_GS_WORKSTATION_STATUS gsws on gsws.ResourceID = fcm.ResourceID
where fcm.CollectionID = @ColID
group by c.Name - Create the final dataset called Software_Update_Details with the query of:
DECLARE @StartDate datetime, @EndDate datetime
Set @StartDate = DATEFROMPARTS(@StartYear,@StartMonth,1)
Set @EndDate = DATEFROMPARTS(@EndYear,@EndMonth,1)
Select ucs.CI_ID, count(ucs.CI_ID) [Count],
CASE((status))
When 3 Then 'Installed' When 2 Then 'Required' Else 'Not Applicable' End as 'Status', BulletinID, ArticleID,
CASE((IsDeployed))
When 0 Then 'No' Else 'Yes' End as 'Deployed',
CASE((ui.IsSuperseded))
When 0 Then 'No' Else 'Yes' End as 'Superseded',
CASE((ui.IsExpired))
When 0 Then 'No' Else 'Yes' End as 'Expired',
ui.Title, ui.DatePosted, cica.CategoryInstanceName,
CASE((ui.Severity))
When 2 Then 'Low'
When 6 Then 'Moderate'
When 8 Then 'Important'
When 10 Then 'Critical'
Else 'NA' End as 'Severity'
From v_Update_ComplianceStatusReported ucs
JOIN v_UpdateInfo ui on ucs.CI_ID = ui.CI_ID
JOIN v_CICategoryInfo_All cica JOIN v_CategoryInfo ci on cica.CategoryInstanceID = ci.CategoryInstanceID AND cica.CategoryTypeName = 'UpdateClassification' on ucs.CI_ID = cica.CI_ID
Where resourceid IN(Select ResourceID from v_FullCollectionMembership where CollectionID = @ColID) AND ui.DatePosted BETWEEN @StartDate AND @EndDate AND ucs.status <> 1
GROUP BY ucs.CI_ID, ucs.status, BulletinID, ArticleID, IsDeployed, ui.Title, DatePosted, cica.CategoryInstanceName, cica.CategoryInstanceID,ui.IsSuperseded, ui.Severity, ui.IsExpired
ORDER BY ucs.status, BulletinID, ArticleID
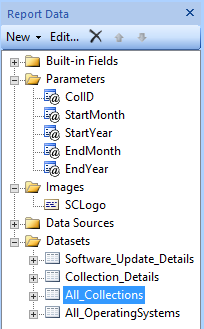
Your Report Data pane should now look like this:
Creating a Custom Report for System Center 2012 R2 Configuration Manager – Part 1
Creating a Custom Report for System Center 2012 R2 Configuration Manager – Part 2
Creating a Custom Report for System Center 2012 R2 Configuration Manager – Part 3
Creating a Custom Report for System Center 2012 R2 Configuration Manager – Part 4
Creating a Custom Report for System Center 2012 R2 Configuration Manager – Part 5