SharePoint - Determining Network Usage in Preparation for a Migration to Office 365
One of my customers is in the process of migrating their SharePoint On-Premises environment to Office 365. With a move to the Cloud this will put additional load onto their existing Internet connection and they asked me if I could help to determine how much network traffic the existing On-Premises environment generates each day servicing end-user requests. This should give a reasonable idea of the likely impact to their Internet connection, it's not perfect but is more accurate than a good old guesstimate!
To do this I requested a days worth of IIS logs from all Web Servers and used good old Log Parser (one of the most useful tools ever created!) and Excel to analyse the date. In this specific case I omitted the search crawl targets to ensure that the data wasn't skewed by traffic generated by search crawls.
I used the Log Parser query below to break down usage per hour, I did this by analysing the sc-bytes (server to client - downloads) and cs-bytes (client to server - uploads) data from reach request.
cd "C:\Program Files (x86)\Log Parser 2.2\"
LogParser "SELECT TO_STRING(time, 'HH') AS Hour,DIV(DIV(SUM(cs-bytes), 1024), 1024) AS [Uploads (MB)], `
DIV(DIV(SUM(sc-bytes), 1024), 1024) AS [Downloads (MB)] INTO D:\HourlyBreakdown.csv `
FROM D:\IISLogs\*.log GROUP BY Hour" -o:csv -i:iisw3c
Simply update the highlighted values and execute, this will then create a CSV file with a breakdown of Uploads and Downloads in MB per hour - replace D:\HourlyBreakdown.csv with the name of the desired output file and D:\IISLogs with a directory that contains a days worth of IIS logs from each Web Server.
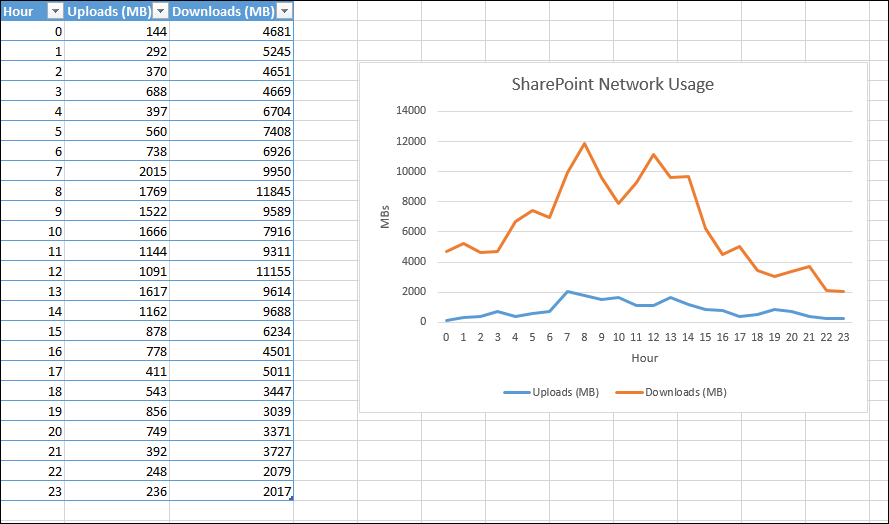
Once the CSV file has been created you can open this with Excel and add a pretty chart, here is my example (also attached for reference).
Brendan Griffin - @brendankarl