Using language R and Azure Machine Learning to load data from Azure SQL Database
This blog post is composed of two parts:
In the first part, we will see how to load data from Azure SQL Database using the R Language installed on my local machine.
In the second part, we will access the same data using Azure Machine Learning, a fully managed cloud service for data scientists and developers, currently in preview, which provides a great support to language R.
Prerequisites
To load data from Azure, we need first to create an Azure SQL Database. If you are new to Azure, you can activate a 30 days free trial here. The process of creating a new SQL Database server is very easy, and a getting started guide is available here. Once created, you will have access to a control panel, represented in the image below.
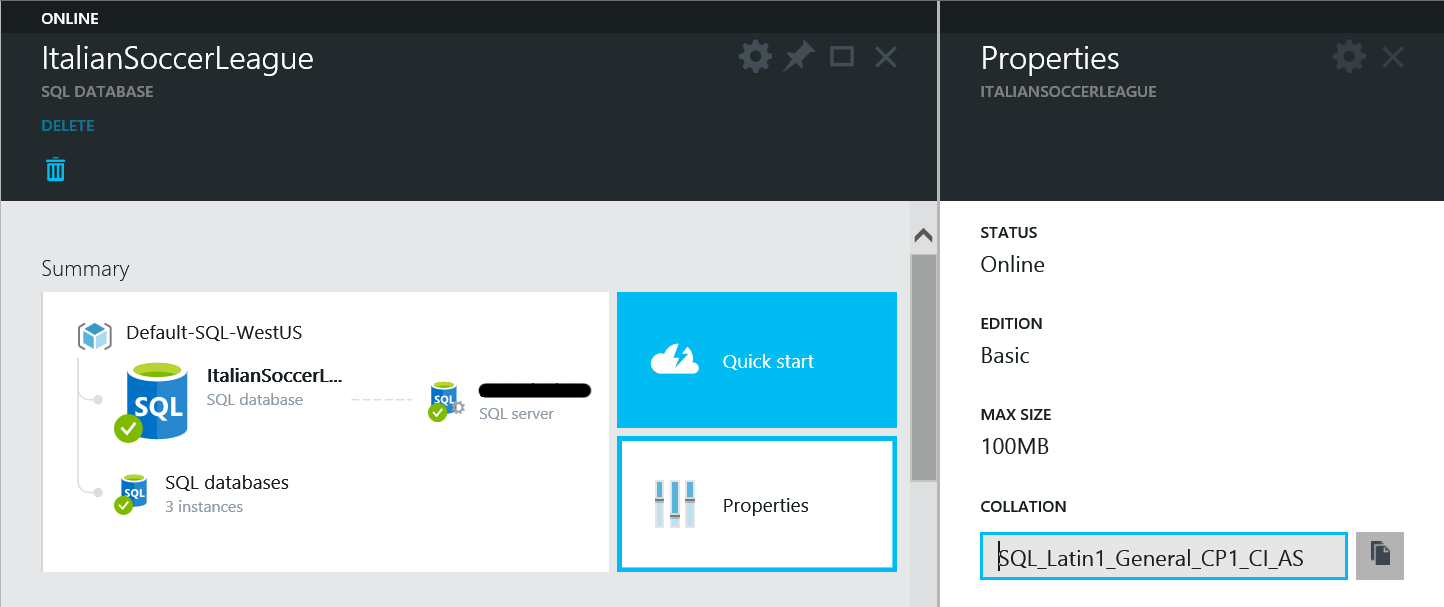
SQL Database is a fully managed service, and Azure will take care of things like high availability and backups.
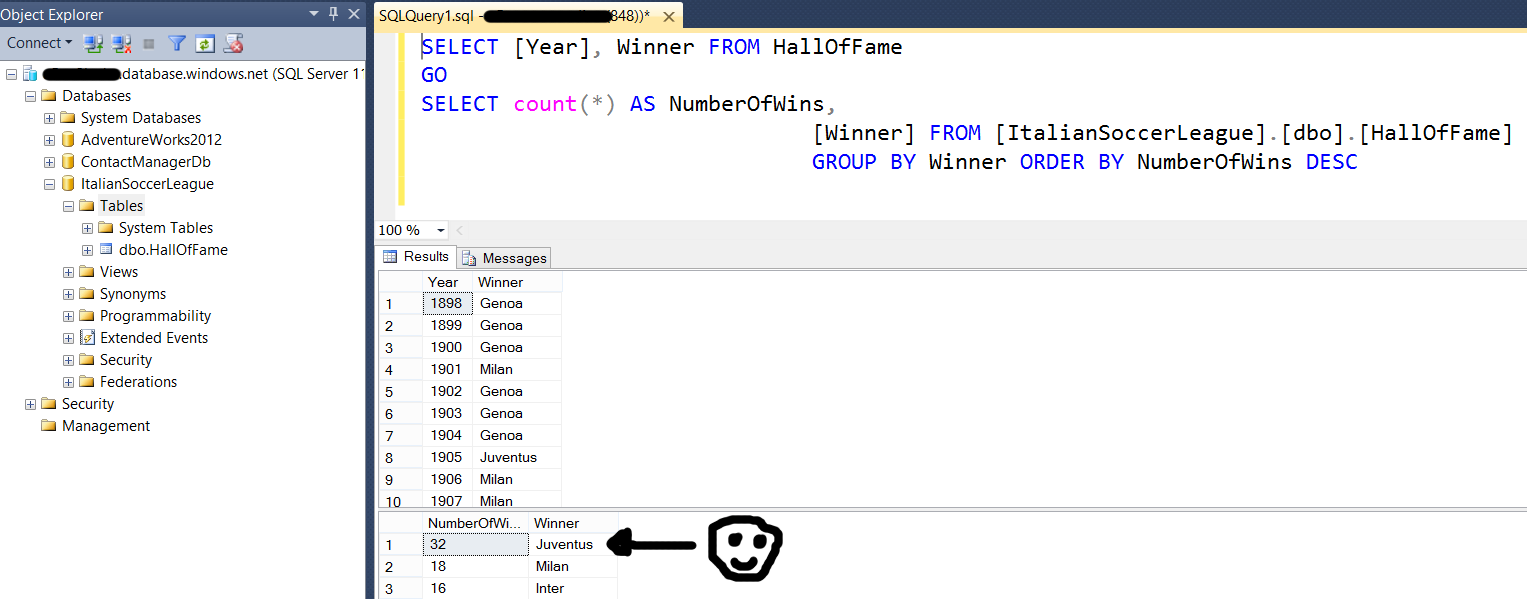
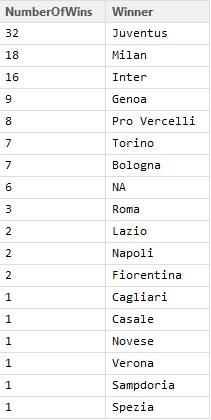
To design the database schema and load data, you can use SQL Server tools like SSMS, which are fully compatible. In our example we will use a dataset with the history of winners of the Italian soccer league (I am a Juventus supporter, so I like the query results shown below very much :) )
Part 1 – load Azure SQL Database data using R
In the first part, we will use R installed locally on my Windows 8.1 laptop. To accomplish this part we need to:
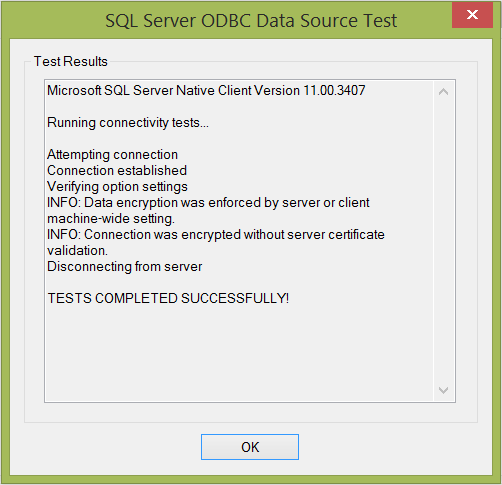
Configure an ODBC dsn to Azure SQL Database
Download and Install R bits here: https://cran.r-project.org/bin/windows/base/
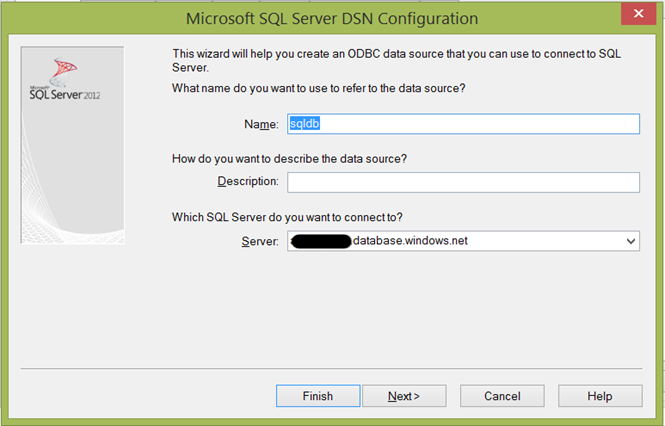
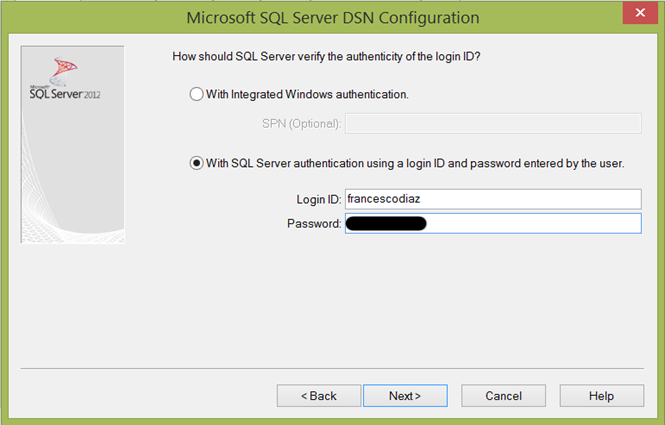
How to create an ODBC dsn
In the first step of the wizard, we need to provide a name for the dsn (sqldb) and the name of the Azure SQL Database Server ([servername].database.windows.net)
We need to specify the default database (ItalianSoccerLeague)
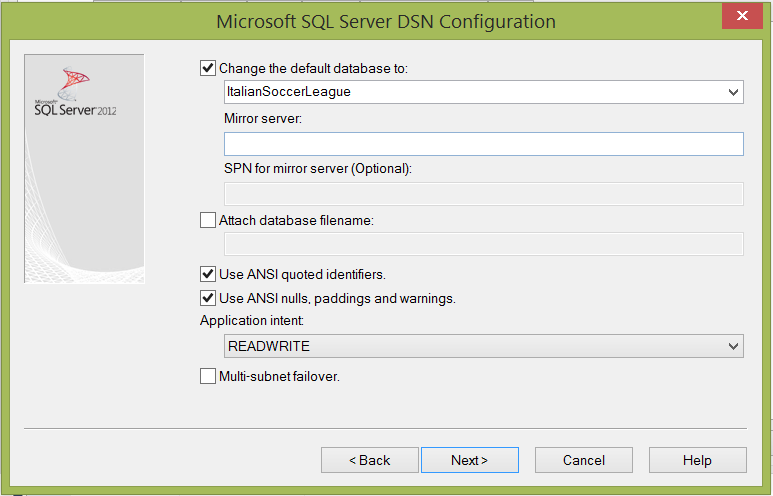
And SQL login and password
Using R to load SQL Database data
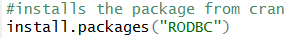
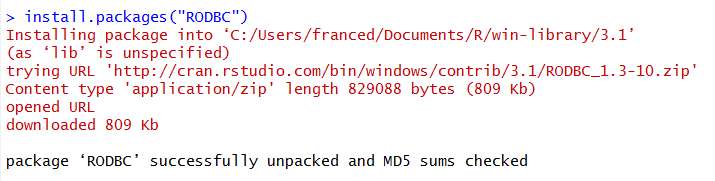
Now we have our ODBC dsn ready. R has lots of packages available, and one of them, called RODBC allows the communication with ODBC data sources. To install a package R we can use the command install.packages(“[package name”)]. The package will be downloaded from the web
Once that the package is installed, we need to load the package, using the following sintax

Now we can open a connection to the Azure SQL Database, using the ODBC dsn, plus the User ID and the Password. odbcConnect is the command that we will use, and the result is assigned to the sqldbcnn variable

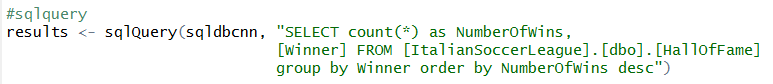
Last step, using sqlQuery, is to execute the query
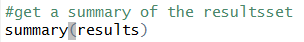
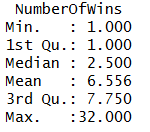
If we need to get a summary of the results, we can use the summary function, passing the results variable as a parameter.
Part 2 – load Azure SQL Database data using Azure Machine Learning
Azure Machine Learning runs inside Microsoft Azure, and it is currently in preview. To get started with Azure Machine Learning you could visit the following page: https://azure.microsoft.com/en-us/trial/get-started-machine-learning/
As we have done in part 1 with R running on my laptop, we will now use Azure Machine Learning to load data from Azure SQL Database. Azure ML provides a designer, called Azure ML Studio, which is a workbench that runs in the browser, e.g. Internet Explorer. You don't need to install anything on your local machine, everything runs inside Azure
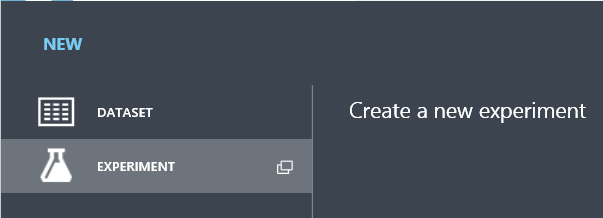
First thing to do is create a new experiment; this will give us access to a graphical designer, the place where the data scientist will spend most of his time.
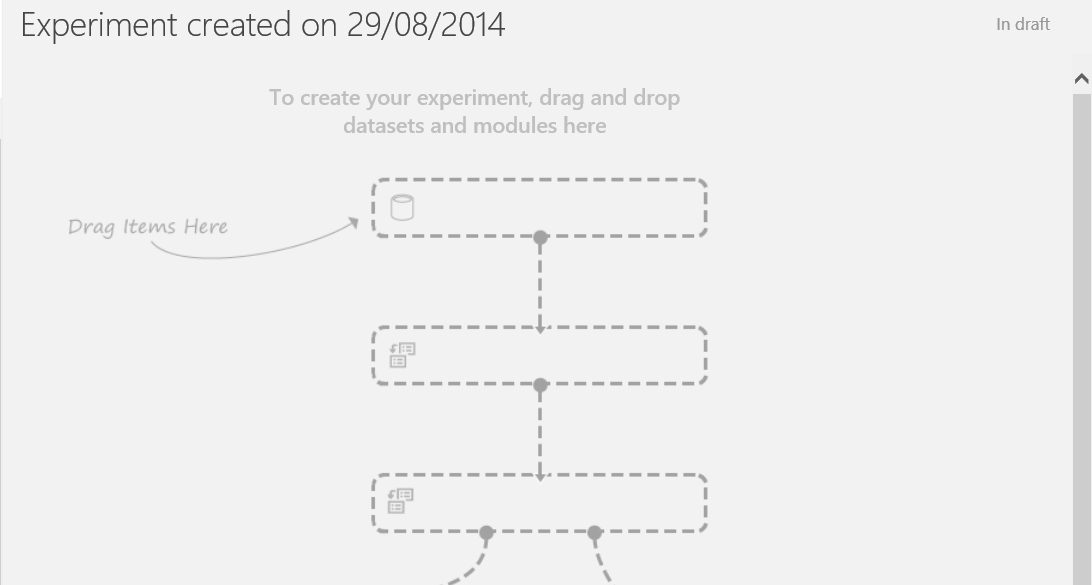
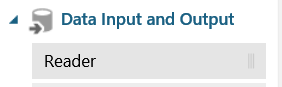
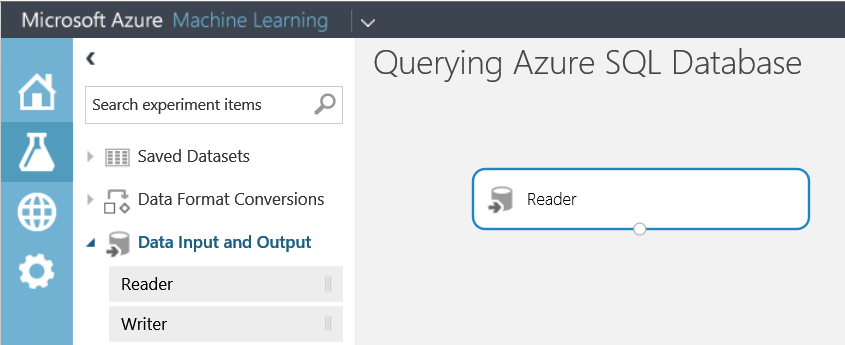
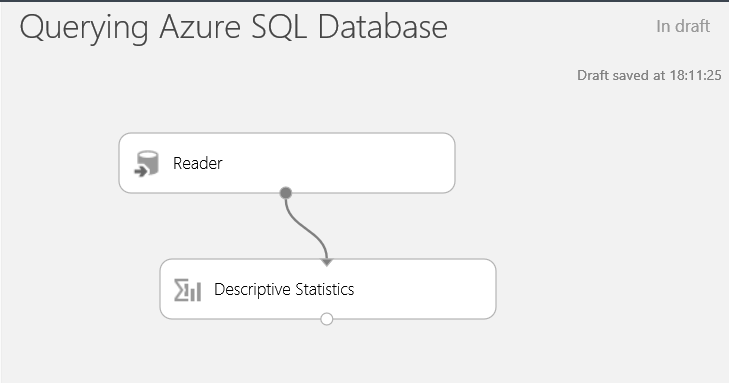
Azure ML is made of many modules, some of them can helps us to load and manipulate data. In this case, we need the Reader module, and we just need to drag and drop it into the designer.
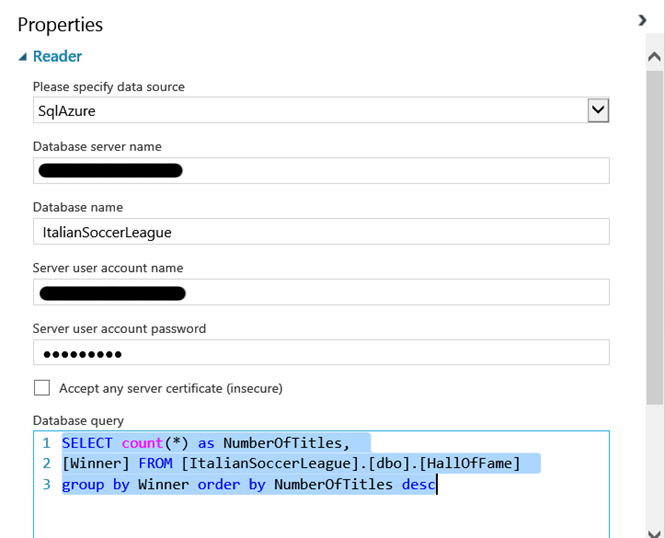
Each module has a properties pane, where we can set all the parameters required to connect to Azure SQL Database, including the query string.
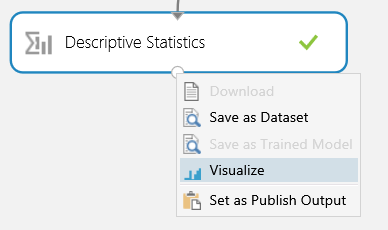
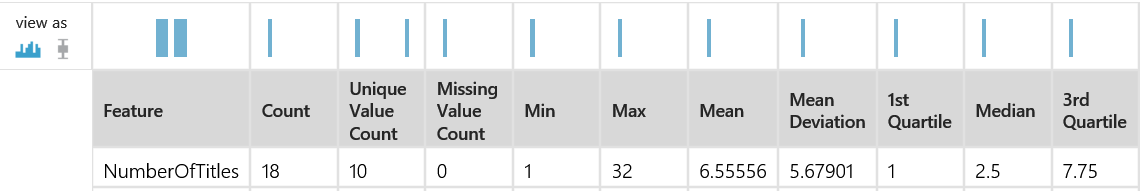
That is all we need to do to get data from Azure SQL Database. As an optional step, we could also use a Descriptive Statistics module, and connect it to the Reader module. This will help to have a more detailed view of our dataset
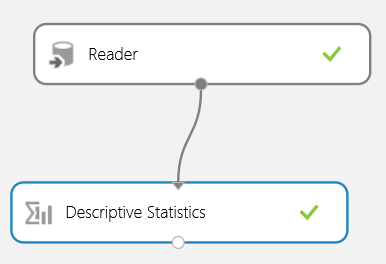
Now we can run our experiment using the RUN icon 
We can visualize the data received from the database using the Visualize command in the context menu.
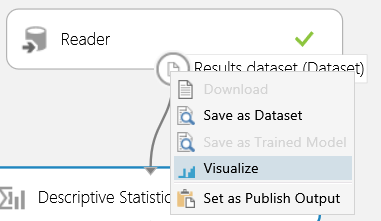
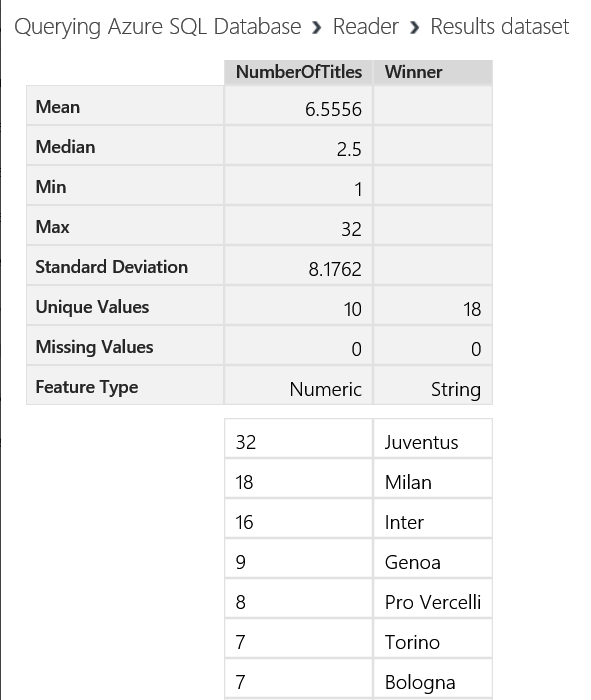
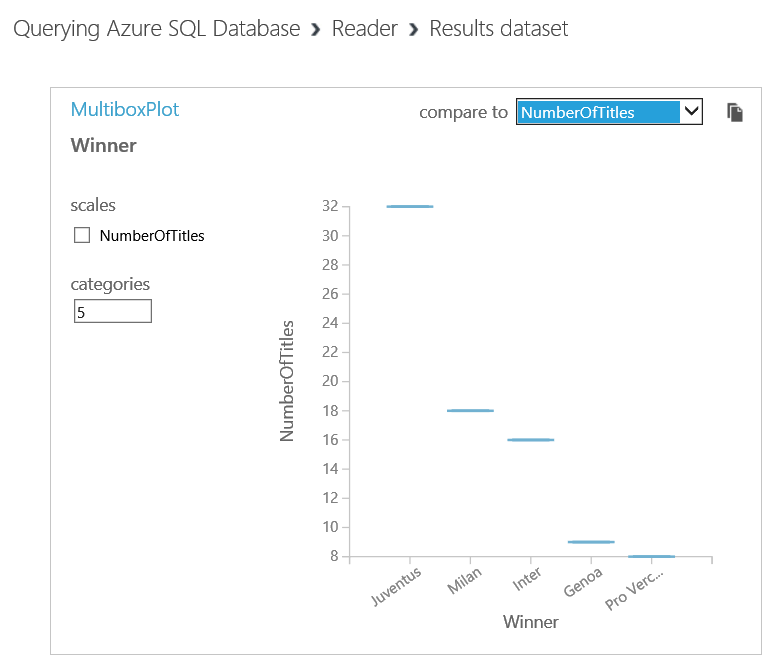
In addition, we could get some additional descriptive information, like a MultiboxPlot to see a graphical representation of our data, or Mean, Min and Max values.
Francesco