Capture Custom Events in Profiler for Troubleshooting
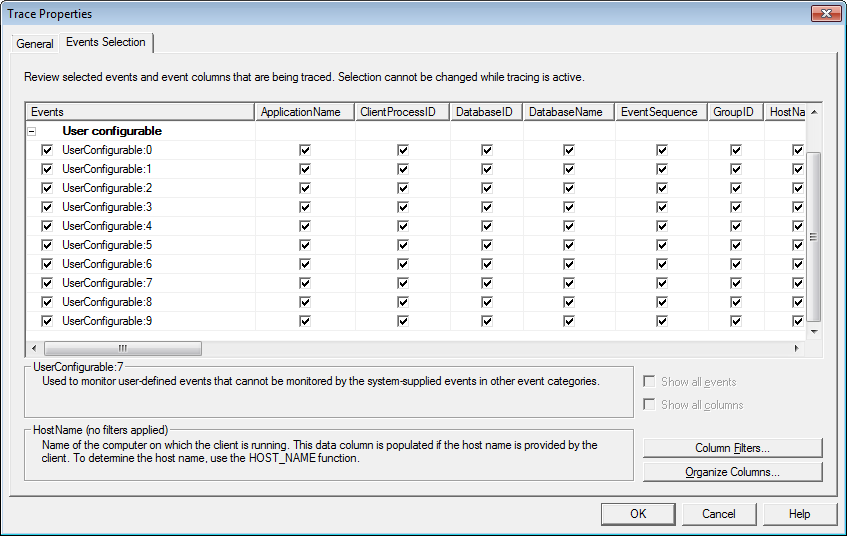
User configurable events have been available in SQL Server since at least version 2000, but aren't often used, I suspect just because DBA's aren't familiar with them. Here's a screen shot of the Events Selection page of the Trace Properties for a SQL Server Profiler trace:
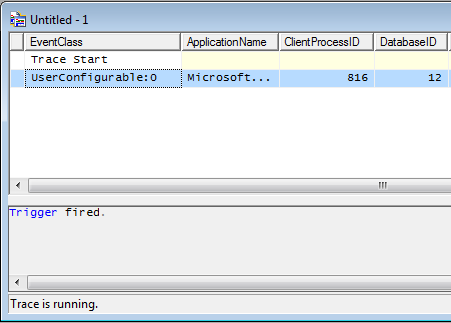
Despite having all of the user configurable events selected, nothing will show up in the trace if you don't create custom events to feed the trace. The easiest way is to use sp_trace_generateevent in your T-SQL code, such as inside a trigger. Here's an example from inside a trigger:
EXEC sp_trace_generateevent 82, N'Trigger fired.'
You can use 82-91 as the first argument, which corresponds to UserConfigurable events 0-9, and then a unicode message (just put an N right before your single-quote delimited message).
When you use custom events like this, you'll often want to capture only the UserConfigurable events, thereby cutting out all the events you don't care about.