Visualize DSC Reporting with PowerBI
Abstract
Reporting is an essential component of DSC and one of the main advantages. Always knowing the status about your nodes and even being able to know which settings are not compliant is a big advantage compared to classical scripting or Group Policies. However, the reporting feature is not so easy to use and there are no graphical reports available yet. Dashboards and diagrams are always good to draw people’s attention. This article describes you to achieve exactly this.
Having the graphical reports should also help explaining to non-technical people the importance of Infrastructure as Code and DSC.
Requirements
This article based on Using SQL Server 2016 for a DSC Pull Server. You need to move from EDB to an MDB with linked tables. All the steps required and additional details are mentioned in this article. The script to create the SQL database referenced in this article adds some views, functions and a trigger to convert the data into proper JSON, also required.
Another requirement may be – depending on the size of the configuration – described in Broken DSC Reporting, RequestEntityTooLarge and some LCM internals.
If you want to test this out without investing too much time, you may want to take a look at AutomatedLab and the script DSC Pull Scenario 1 (Pull Configuration, SQL Reporting).ps1 in paticular. This script deploys a lab that has a DSC Pull Server, SQL Server 2016 and PowerBI already configured.
Desired Result
The result after having implemented the reporting as described here looks like this:
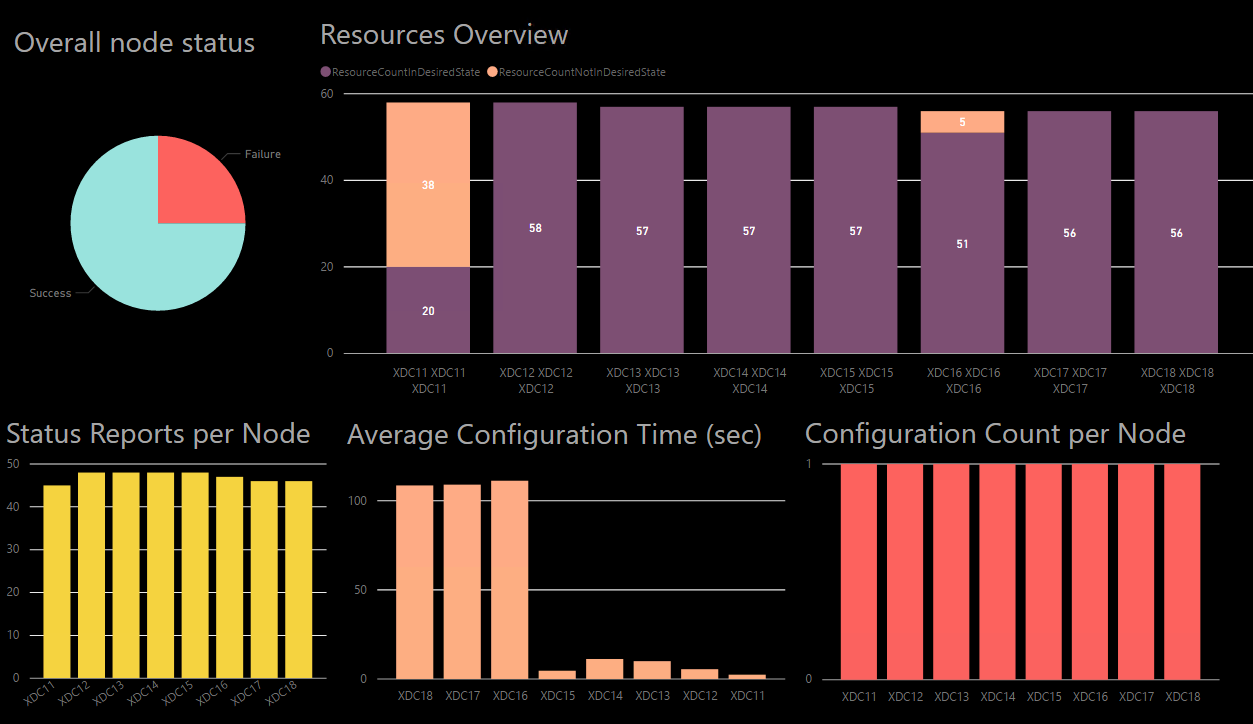
This dashboard lets you very easily see the overall status of your DSC nodes. In the current version, you get these information:
- Node Status, count of success and failure
- Count of compliant / non-compliant configuration items per node
- Average duration it takes to apply the configuration
- Status reports and configurations per node
The dashboard is quite extensible and can visualize almost anything that is covered with the data in the DSC database.
The heavy lifting behind the scenes
Note: This section is not essential to read of you just want to use the reporting solution and do not face issues.
The pull server stores most of the data as JSON into the database. However, the JSON data cannot be converted back from JSON so easy and seems to be serialized more than once.
This is how the data looks like
[code lang="powershell"]
Invoke-Sqlcmd -Query 'SELECT TOP 1 StatusData FROM Statusreport' -Database DSC | Select-Object -ExpandProperty StatusData
["{\"StartDate\":\"2017-05-21T18:20:51.5710000+02:00\",\"IPV6Addresses\":[\"fe80::2c81:cc87:4f57:e1d9%2\",\"::2000:0:0:0\",\"::1\",\"::2000:0:0:0\"],\"DurationInSeconds\":\"5\",\"JobID\":\"{74703B6E-3E41-11E7-8365-0017FA00000C}\",\"CurrentChecksum\":\"30B2DD729B96A4DFCB882379448A9183C00B77EE754CCA5C84D76124AE16B151\",\"MetaData\":\"Author: Install; Name: PullClient; Version: 2.0.0; GenerationDate: 05/21/2017 18:04:02; GenerationHost: XPULL1;\",\"Status\":\"Success\",\"IPV4Addresses\":[\"192.168.88.8\",\"127.0.0.1\"],\"LCMVersion\":\"2.0\",\"NumberOfResources\":\"0\",\"Type\":\"LocalConfigurationManager\",\"HostName\":\"XDC13\",\"RebootRequested\":\"False\",\"MACAddresses\":[\"00-17-FA-00-00-0C\",\"00-00-00-00-00-00-00-E0\"],\"MetaConfiguration\":{\"AgentId\":\"1B664F0D-3E3F-11E7-8365-0017FA00000C\",\"ConfigurationDownloadManagers\":[{\"RegistrationKey\":\"\",\"ServerURL\":\"https://xpull1:8080/PSDSCPullServer.svc\",\"ResourceId\":\"[ConfigurationRepositoryWeb]PullServer\",\"ConfigurationNames\":[\"Complete_xDC13\"],\"SourceInfo\":\"C:\\\\Users\\\\Install.BMW\\\\Desktop\\\\DscScripts\\\\2.2 SetupDScClients.ps1::26::9::ConfigurationRepositoryWeb\"}],\"ActionAfterReboot\":\"ContinueConfiguration\",\"LCMCompatibleVersions\":[\"1.0\",\"2.0\"],\"LCMState\":\"Idle\",\"ResourceModuleManagers\":[],\"ReportManagers\":[{\"RegistrationKey\":\"\",\"ServerURL\":\"https://xpull1:8080/PSDSCPullServer.svc\",\"ResourceId\":\"[ReportServerWeb]ReportServer\",\"SourceInfo\":\"C:\\\\Users\\\\Install.BMW\\\\Desktop\\\\DscScripts\\\\2.2 SetupDScClients.ps1::34::9::ReportServerWeb\"}],\"StatusRetentionTimeInDays\":\"10\",\"LCMVersion\":\"2.0\",\"ConfigurationMode\":\"ApplyAndAutoCorrect\",\"RefreshFrequencyMins\":\"30\",\"RebootNodeIfNeeded\":\"True\",\"SignatureValidationPolicy\":\"NONE\",\"RefreshMode\":\"Pull\",\"DebugMode\":[\"NONE\"],\"LCMStateDetail\":\"\",\"AllowModuleOverwrite\":\"False\",\"ConfigurationModeFrequencyMins\":\"15\",\"SignatureValidations\":[]},\"Locale\":\"en-US\",\"Mode\":\"Pull\"}"]
PowerShell cannot convert this data using ConvertFrom-Json and SQL Server cannot read it either using OPENJSON. The data needs to be converted first. The solution was mentioned first in Get DSC Pull Client Status and is actually quite simple. To make the conversion happen completely transparent to the user and without manual interaction, I have created a database trigger that takes care of that.
After the conversion, the StatusData column looks like this:
{"StartDate":"2017-05-21T18:57:28.2910000+02:00","IPV6Addresses":["fe80::e466:5405:663c:6ac3%3","::2000:0:0:0","::1","::2000:0:0:0"],"DurationInSeconds":"12","JobID":"{91CB841E-3E46-11E7-8365-0017FA00000D}","CurrentChecksum":"0FA45B9AE2E7CA252D64AA40DE8AFD1F9B19E02844F57498F22C1FD700F31E90","MetaData":"Author: Install; Name: Complete; Version: 2.0.0; GenerationDate: 05/21/2017 18:03:44; GenerationHost: XPULL1;","RebootRequested":"False","Status":"Success","IPV4Addresses":["192.168.88.9","127.0.0.1"],"LCMVersion":"2.0","NumberOfResources":"1","Type":"Initial","HostName":"XDC14","ResourcesInDesiredState":[{"SourceInfo":"C:UsersInstall.BMWDesktopDscScripts1.2 NewDscConfig.ps1::61::21::File","ModuleName":"PSDesiredStateConfiguration","DurationInSeconds":"0.019","InstanceName":"TestFile","StartDate":"2017-05-21T18:57:40.6890000+02:00","ResourceName":"File","ModuleVersion":"1.1","RebootRequested":"False","ResourceId":"[File]TestFile","ConfigurationName":"Complete","InDesiredState":"True"}],"MACAddresses":["00-17-FA-00-00-0D","00-00-00-00-00-00-00-E0"],"MetaConfiguration":{"AgentId":"1B67D9E9-3E3F-11E7-8365-0017FA00000D","ConfigurationDownloadManagers":[{"RegistrationKey":"","ServerURL":"https://xpull1:8080/PSDSCPullServer.svc","ResourceId":"[ConfigurationRepositoryWeb]PullServer","ConfigurationNames":["Complete_xDC14"],"SourceInfo":"C:UsersInstall.BMWDesktopDscScripts2.2 SetupDScClients.ps1::26::9::ConfigurationRepositoryWeb"}],"ActionAfterReboot":"ContinueConfiguration","LCMCompatibleVersions":["1.0","2.0"],"LCMState":"Idle","ResourceModuleManagers":[],"ReportManagers":[{"RegistrationKey":"","ServerURL":"https://xpull1:8080/PSDSCPullServer.svc","ResourceId":"[ReportServerWeb]ReportServer","SourceInfo":"C:UsersInstall.BMWDesktopDscScripts2.2 SetupDScClients.ps1::34::9::ReportServerWeb"}],"StatusRetentionTimeInDays":"10","LCMVersion":"2.0","ConfigurationMode":"ApplyAndAutoCorrect","RefreshFrequencyMins":"30","RebootNodeIfNeeded":"True","SignatureValidationPolicy":"NONE","RefreshMode":"Pull","DebugMode":["NONE"],"LCMStateDetail":"","AllowModuleOverwrite":"False","ConfigurationModeFrequencyMins":"15","SignatureValidations":[]},"Locale":"en-US","Mode":"Pull"}
Now the data can be just taken to PowerShell and converted with ConvertFrom-Json and also SQL Server is happy.
When the LCM starts applying a configuration (Start-DscConfiguration), it writes an entry of type ‘Initial’ into the reporting database. This record has a StartTime but not yet a valid EndTime. Also, StatusData only contains some basic information about the node.
Note: The OperationType ‘Initial’ indicates that the node applies a configuration the first time. All subsequent applications are logged with the OperationType ‘Consistency’. The OperationType ‘LocalConfigurationManager’ logs the configuration of the LCM.
The trigger fires after an update happens. When the pull server send the StatusData to the database, backslashes are removed and the characters indicating an array in JSON.
[code lang="sql"]
CREATE TRIGGER [dbo].[DSCStatusReportOnUpdate]
ON [dbo].[StatusReport]
AFTER UPDATE
AS
SET NOCOUNT ON
BEGIN
DECLARE @JobId nvarchar(50) = (SELECT JobId FROM inserted);
DECLARE @StatusData nvarchar(MAX) = (SELECT StatusData FROM inserted);
IF @StatusData LIKE '\[%' ESCAPE '\'
SET @StatusData = REPLACE(SUBSTRING(@StatusData, 3, Len(@StatusData) - 4), '\', '')
DECLARE @Errors nvarchar(MAX) = (SELECT [Errors] FROM inserted);
IF @Errors IS NULL
SET @Errors = (SELECT Errors FROM StatusReport WHERE JobId = @JobId)
IF @Errors LIKE '\[%' ESCAPE '\' AND Len(@Errors) > 4
SET @Errors = REPLACE(SUBSTRING(@Errors, 3, Len(@Errors) - 4), '\', '')
UPDATE StatusReport
SET StatusData = @StatusData, Errors = @Errors
WHERE JobId = @JobId
END
After the conversion, SQL Server can parse and query the data in the column StatusData as JSON. This is the process of getting to the details in a JSON-formatted column.
How to retrieve data from a JSON column
This query is getting just the "StartDate" for all nodes. StartDate is a value in the JSON column "StatusData".
[code lang="sql"]
SELECT dbo.StatusReport.NodeName, JSON_VALUE([StatusReport].StatusData, '$.Status')
FROM dbo.StatusReport
or
[code lang="sql"]
SELECT dbo.StatusReport.NodeName,(
SELECT [Value]
FROM OPENJSON ([StatusData])
WHERE [Key] = 'StartDate'
) AS StartDate
FROM dbo.StatusReport
The functions “tvfGetNodeStatus” and “tvfGetRegistrationData” are for combining the data accessible directly using SQL and what is store as JSON. The queries in these functions are more complex, as there is JSON stored in JSON stored in SQL.
These two functions can be access through the views “vRegistrationData” and “vNodeStatusComplex” and these views are used by PowerBI.
PowerBI - the interesting part
Starting with a new workbook
So, after having the database in place and some nodes registered and have them already send some feedback, it is time to make the data visible.
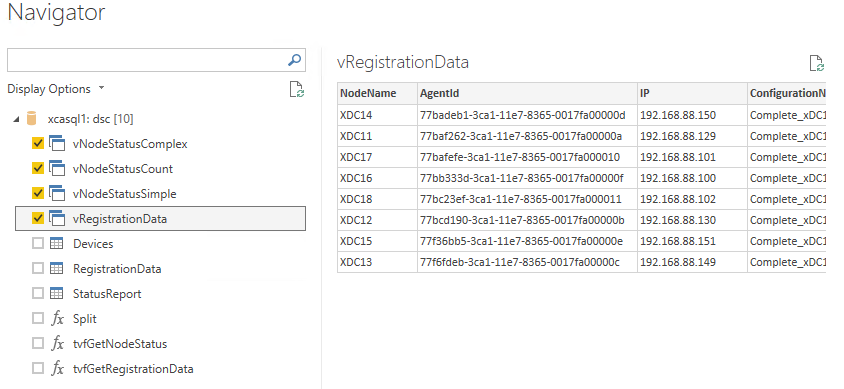
After opening PowerBI you will see a welcome screen. There is an option named "Get data". After clicking on that option, you will be guided through the process of setting up the connection. Please select "SQL Server database", then you have to provide a server and database name and decide if you want to import the data or use DirectQuery. After finishing that you should see a list of all available sources. Please select all the views here (v*) and click on load.
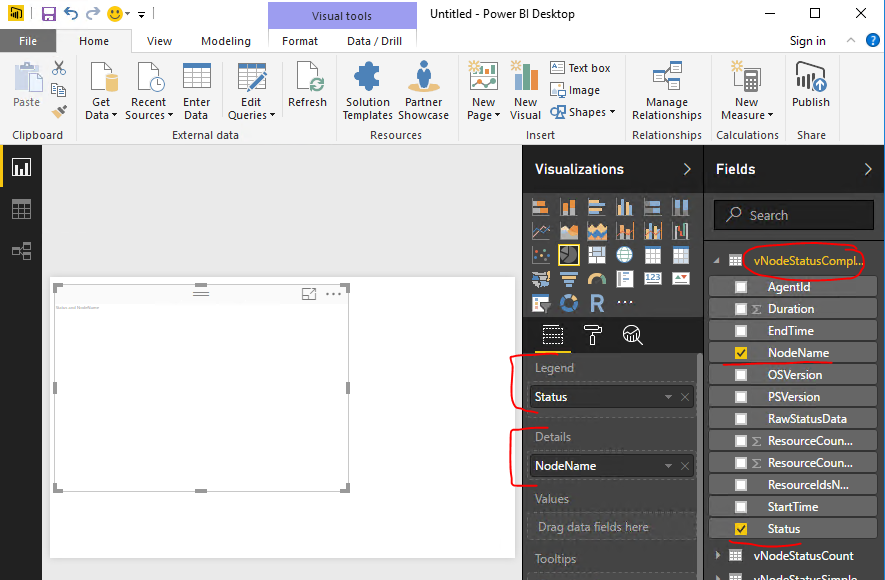
After finishing this step, you have to choose a visualization. Click on the Pie Chart and you get a grey template on your empty workbook. Keep the focus on the Pie Chart and in the Fields menu on the right side expand the node "vNodeStatusComplex". Please select from the field "Status" first and then "NodeName". This will move "Status" to "Legend" and "NodeName" to "Details".
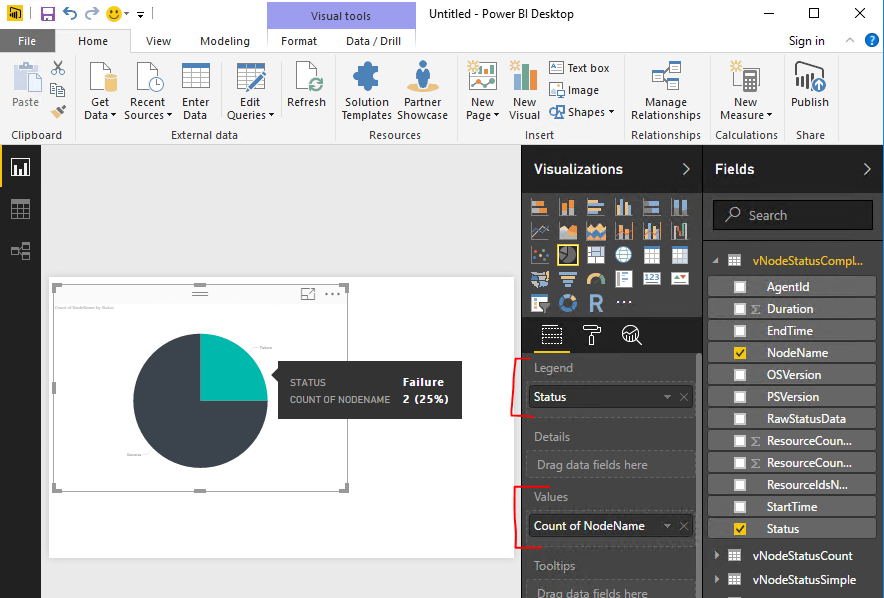
Obviously, this does not work. Please drag and drop the "NodeName" from "Details" to "Values". Voila, if all your DSC nodes are compliant, you have now a Pie Chart with just one big piece. In my environment, 2 out of 8 does have problems so it looks like this:
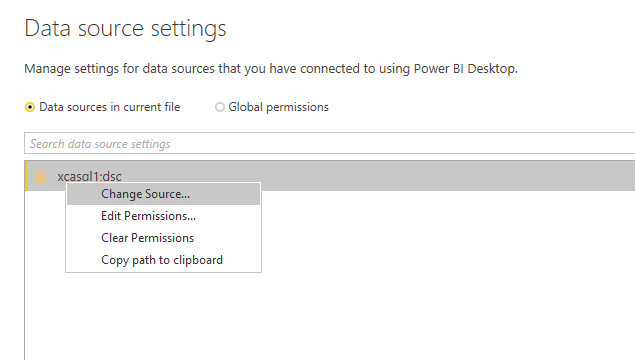
Using an existing workbook
If you want to get started quickly, you can download the PowerBI file Dashboard.pbix, the first screenshot has been taken from this file. You have to change the data source as your SQL Server pretty likely has a different name. Click on "Edit Queries -> Data source settings" and then on "Change Source".
Summary
After walking through this article, you have a database on SQL Server 2016 that presents the node status data in a way that can be visualized with PowerBI or other tools. This moves DSC on a new level and should makes it more appealing for IT managers.