Tales of the Weird: High Memory Utilization within Exchange Servers running on Windows Server 2016
Here is another case from the "Tales of the Weird and Unusual" bin at Microsoft Exchange Support. Over the last couple of weeks we have seen a few cases where customers are reporting very high memory utilization within their Exchange 2016 environments, however the catch is all of these customers were running on Windows Server 2016. While memory utilization on Exchange can sometimes take a very serious note in several cases we were seeing where customers were adding in additional RAM into their environments, but still seeing high memory utilization or we were seeing the servers complain about not having enough memory. As a result, we would also see excessive system paging. We may even see error messages in our application logs such as the following:
Time: 1/2/2018 1:15:00 PM
ID: 906
Level: Warning
Source: ESE
Machine: MBX01.contoso.com
Message: Information Store - MBXDB1 A significant portion of the database buffer cache has been written out to the system paging file. This may result in severe performance degradation.
See help link for complete details of possible causes.
Previous cache residency state: 100% (4657 out of 4657 buffers) (867 seconds ago)
Current cache residency state: XX% (XXXX out of XXXX buffers)
Current cache size vs. target: XX% (XXX / XXX MBs)
Physical Memory / RAM size: 96 GB
You may even seen errors such as the following:
Time: 1/1/2018 1:57:29 PM
ID: 1009
Level: Warning
Source: MSExchangeFastSearch
Machine: MBX01.contoso.com
Message: The indexing of mailbox database MBXDB1 encountered an unexpected exception. Error details: Microsoft.Exchange.Search.Core.Abstraction.OperationFailedException: The component operation has failed. ---> Microsoft.Exchange.Search.Core.Abstraction.ComponentFailedPermanentException: Failed to read notifications, MDB: MBX-GUID-GOES-HERE. ---> Microsoft.Mapi.MapiExceptionMdbOffline: MapiExceptionMdbOffline: Unable to read events. (hr=0x80004005, ec=1142)
Now, if we are in a virtualized environment, one of the items your storage teams may report is your disk I/O rises dramatically. If you are using high speed storage, such as SSD's, you may not see anything even show up on your disk latencies, but your storage team would notice the increased disk I/O.
What you also may see is SystemCacheWs using a great deal of working set memory.
If you start seeing the above issues, your issue may be fixed by applying one or more of the items below.
Our most common causes are as follows:
- Not using static resources within your virtualized host.
- Anti-Virus Exclusions not being abided by.
- Update to the Windows System when using ReFS.
Static Resources and Virtualization:
We have discussed virtulization in great detail at https://technet.microsoft.com/en-us/library/jj619301(v=exchg.160).aspx, and there have been other articles put out by fellow engineers, but one of the biggest disagreements from customers is when we see is the requirement for static resources within our virtualized host, and why we have to do it. In our TechNet articles we state the following:
Some hypervisors have the ability to oversubscribe/overcommit or dynamically adjust the amount of memory available to a specific guest machine based on the perceived usage of memory in the guest machine as compared to the needs of other guest machines managed by the same hypervisor. This technology makes sense for workloads in which memory is needed for brief periods of time and then can be surrendered for other uses. However, it doesn't make sense for workloads that are designed to use memory on an ongoing basis. Exchange, like many server applications with optimizations for performance that involve caching of data in memory, is susceptible to poor system performance and an unacceptable client experience if it doesn't have full control over the memory allocated to the physical or virtual machine on which it's running. As a result, using dynamic memory or memory overcommit features for Exchange isn't supported.
In non-geek speak, what does this mean? This means we need to make sure we are using static resource allocations within our virtualization environment, otherwise we can see unexpected behavior, which would include (but is not limited to) resource constraints, poor system performance, and client connectivity issues.
But, my virtualization team told me we have static resources already!
Great! We can check this! Here's how we can check! We can use perfmon, and then look up a specific counter to see if we have static resources allocated to our Exchange servers! If you look for the VM Memory ==> Memory Reservation in MB that counter will show you if you have a static memory allocation for your Exchange server. If you don't, you will see something similar to below:
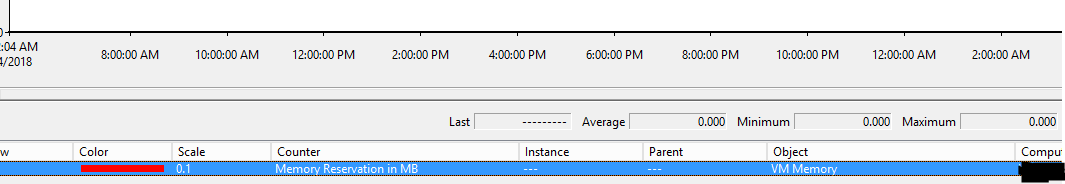
If you see zeros all across, then you know you static resources are not configured, and we will need to configure this within our virtualization environment.
Anti-Virus Exclusions and You:
The other common item we see causing higher memory usage can be Anti-virus software. Modern AV software is very, very good at what it does, to the point we need to make sure we have our exclusions configured correctly, otherwise we can see memory go out of control, among a number of other performance issues. Even if our AV exclusions are configured correctly today, we still should check the exclusions and verify them with an EICAR test from time to time. As discussed in a previous blog post, if our exclusions are not configured correctly, we can see errors in our application logs like this:
Time: 1/1/2017 1:01:10 AM
ID: 489
Level: Error
Source: ESE
Machine: mail.contoso.com
Message: msexchangerepl (4456) An attempt to open the file "D:\Databases\DB01.EDB" for read only access failed with system error 32 (0x00000020): "The process cannot access the file because it is being used by another process. ". The open file operation will fail with error -1032 (0xfffffbf8).
Additionally, some of our customers have reported high disk I/O times, however we see no corresponding spike on our storage array.
Great! How can I check if my AV exclusions are not set right!
There are three easy ways we can detect if our AV exclusions are not configured correctly.
- Check our application logs for the Event ID 489. If we see we are unable to open files because they are being locked, this is a sign our exclusions are not configured correctly.
- Disk performance counters. If we open up performance monitor, and we look at the following counter:
- MSExchange Database ==> Instances, and then you add in the I/O Database Reads (Attached) Average Latency and I/O Database Writes (Attached) Average Latency, and add in your specific databases that are mounted on your server, as seen below:
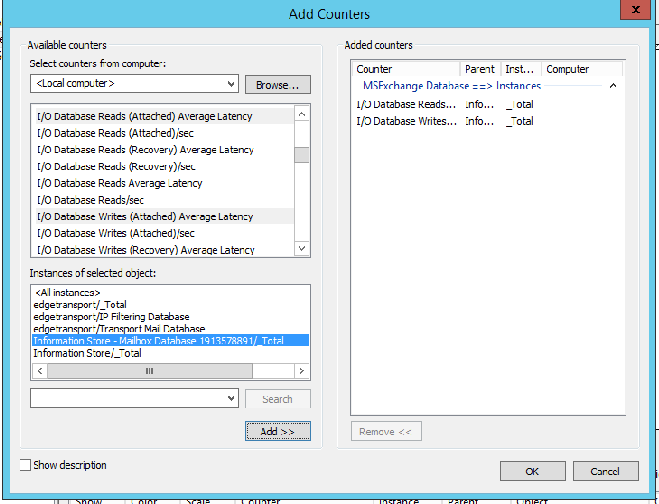
- If you see spikes on your databases, specifically above 50ms, AND we do not see any corresponding spike in disk latency (LogicalDisk --> Average Disk Sec Read Logical Disk --> Average Disk Sec Write counters) then there is a high degree of likelihood we either have reconfigured backups or our Anti-Virus is scanning our databases, resulting in latencies. Because AV has to load our database files somewhere while it scans the metadata and does exactly what it is supposed to do, we can see very high latencies and see very high memory usage which may or may not be attributed to the AV software itself. Because modern AV software runs as part of the system, you will not necessarily see the spike go to the av process.
- Perform an EICAR test. Place the EICAR test file in one of our database paths for example, and see if your AV software detects it. If it does, then we know we need to adjust our AV configuration.
- MSExchange Database ==> Instances, and then you add in the I/O Database Reads (Attached) Average Latency and I/O Database Writes (Attached) Average Latency, and add in your specific databases that are mounted on your server, as seen below:
Again, this isn't the fault of AV doing anything wrong or bad. Modern AV software is very good at what it does, and if the AV software gets into memory, and the filter drivers start to scan your Exchange databases and delay or prevent Exchange from performing certain tasks, this can cause higher memory usage which does not have an attributable process.
ReFS on Windows Server 2016
The last item we have seen is when you are using ReFS with Windows Server 2016. We discuss this here where we state:
To provide greater resiliency for its metadata, the Resilient File System (ReFS) in Windows Server 2016 uses allocate-on-write semantics for all metadata updates. This means that ReFS never makes in-place updates to metadata. Instead, it makes all writes to newly allocated regions.
However, allocating-on-write causes ReFS to issue more metadata I/O to new regions of the volume than write-in-place file systems do. Additionally, ReFS uses block caching logic to cache its metadata in RAM. This is not as resource-efficient as file caching logic.
Together, the ReFS block caching logic and allocate-on-write semantics cause ReFS metadata streams to be large. ReFS uses the cache manager to create the metadata streams, and the cache manager lazily unmaps inactive views. In some situations, this lazy unmapping causes the active working set on the server to grow. This creates memory pressure that can cause poor performance.
In order for us to change these registry settings, make sure you have applied KB 4013429 first. This is the KB which introduces the tune-able parameters. We have released a workaround for ReFS, and when we look at the options for resolution, it's been our experience most of our customers will implement all three options, or some combination thereof. CAUTION: With the workaround, you will be required to edit your registry. Make sure you apply the registry settings correctly, and always take backups.
One of the biggest questions we get is what do those registry changes do? We explain it further on:
To update its metadata, ReFS uses allocate-on-write instead of writing-in-place to improve its resiliency to corruption.
Writing-in-place is susceptible to torn writes. This occurs if a power failure or an unexpected dismount causes a write to be only partially completed.
Allocating-on-write enables ReFS to reliably maintain metadata consistency after a power failure or an unexpected dismount. This is because ReFS can still reference the previous, consistent metadata copy.
Keep in mind, a reboot is required after applying the above fix.
I hope this helps to address your high memory usage within your Exchange servers you may have been seeing recently. If you apply the above and the issue persists, or the information above does not apply to you, please feel free to open up a support case and one of our awesome Exchange Support Engineers would be happy to assist!
A special thank you to Josh Hagen and Joe "PP" Santwire for their assistance in this blog.
-Eric Whitehill, Support Escalation Engineer