Microsoft Lync Server 2010 Resource Kit Tool: Snooper
Snooper is a
multipurpose debugging tool for Microsoft Lync Server 2010 communications
software. Snooper parses server and client trace log files and makes protocol (for
example, SIP and HTTP) messages and traces easier to read. It can also read call
details and stored procedure execution reports for errors. In addition, Snooper
can display reports about users, conferences, and conferencing servers (also
known as multipoint control units or MCUs). You can download this tool and
other Microsoft Lync Server 2010 Resource Kit tools from the Download Center.
Authors: Sankaran Narayanan, Dhigha Sekaran, Namendra Kumar
Publication date: January 2011
Product version: Microsoft Lync Server 2010
Introduction
Snooper was
developed to make the task of finding and analyzing debugging information for
Lync Server 2010 easier. It can be used for the following tasks:
-
Viewing
server and client trace files: Snooper currently parses all server trace
files and client UCCP log files. It provides all the sorting, searching, and
filtering capabilities that are seen in Event Viewer.
**Viewing<br>protocol messages extracted from server and client trace files:** Snooper can
parse the log files for protocol messages such as SIP and HTTP, and then show
them in a way that is easier to analyze. The following log types are supported:
  -
    Server Sip Stack
  -
    Client UCCP
  -
    S4
  -
    McuInfra C3P (http)
  -
    Focus C3P (http)
  -
    PSOM/LDM
  -
    Mediation Server
- Viewing call
detail recordings (CDRs) from Monitoring Server: This helps with the
analysis of call failures. Snooper has filtering and report generation options to
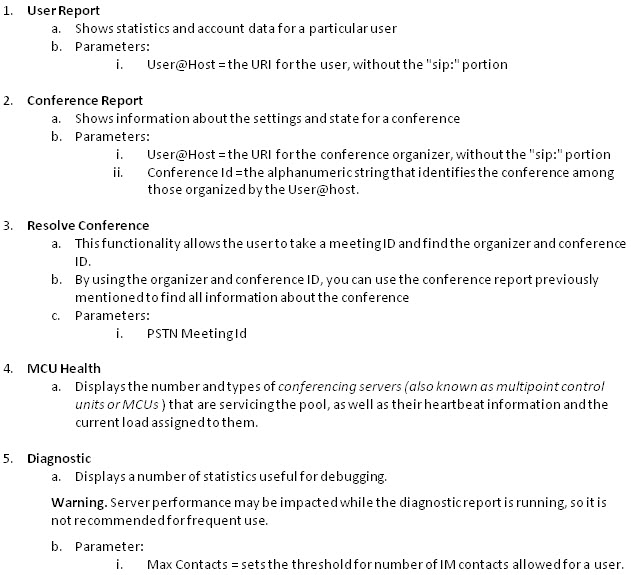
make the task easier. - Viewing user
reports: Snooper can display all the information that is stored in the
database about the user in an easy to analyze way. This is helpful when
diagnosing problems specific to a user. - Viewing
details about a conference: You can get all the conference information that
is related to a user in a user report, and then use the identifier to get all the
information about a conference. - Resolving conference issues: If you have the
meeting ID, you can find the conference ID, and then get all the details about
the conference. - Viewing health of MCUs
- Viewing diagnostic information about the Lync
Server 2010 pool: Data such as the number of resources and Front End servers, the
file size of the databases, and things that might be wrong (for example,
improperly homed resources).
You can download this tool and other Microsoft Lync Server
2010 Resource Kit tools from the Download Center.
Description
The following sections give an overview of each feature.
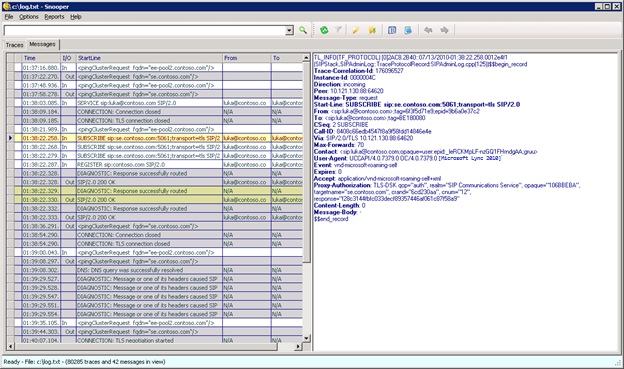
Trace Viewer
Snooper can be used to view traces in server and client UCCP log files. Figure
1 shows the output after the file is opened.
Figure 1. Trace viewer
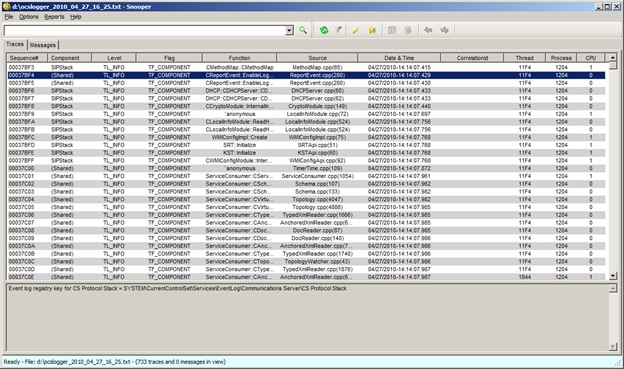
Functions
Trace viewer can do the following:
- Sort traces by column.
Search using the following columns:
  -
    Function
  -
    Source
  -
    CorrelationID
  -
    Log Text
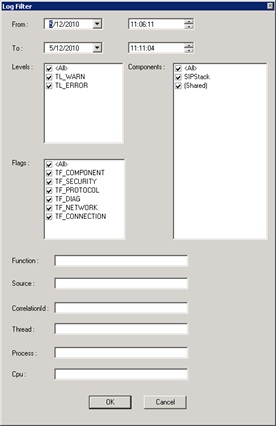
- Filter using the important columns. Click Filter
to open the filter dialog box as shown in Figure 2.
Figure 2. Log filter options
-
Distinguish warnings (yellow) from errors (red)
in output as shown in Figure 3.
Figure 3. Warning and error example

-
Mark a trace row as shown in Figure 4.
Figure 4. Marked row

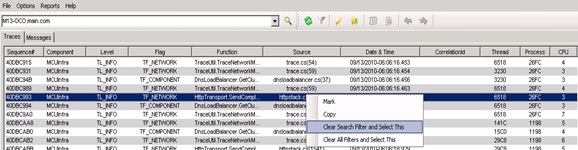
-
Clear filters and zoom in on one row, which
allows you to do the following:
-
If you search for something and find it, you
might want to look at other events near the searched entry. You can use this
functionality to clear the search (or filter), and then go to the currently
selected trace.
-
If you click Clear Search Filter and Select This, as shown in Figure 5, or click
Clear All Filters and Select This,
the search filter (or all filters) are cleared, but the currently selected
trace remains the selected item. Additionally, this item is marked.
Figure 5. Clearing filters
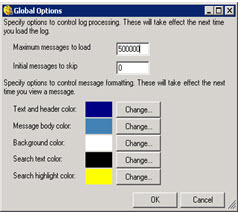
Other Notes About Trace Viewer
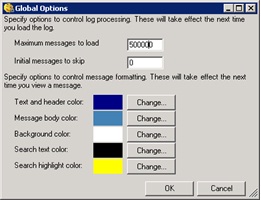
You can change the maximum number of traces shown at one
time by clicking Options and then
clicking Advanced. Most of the
options in this dialog box shown in Figure 6 make sense only for protocol
messages.
Figure 6. Global Options
If the number of traces in the log file is greater than the
maximum configured number (the limit is 2^31 -1), click Parse Forward on the toolbar. This opens the Options menu and you can see an indication on the status bar that
more traces are present. You can use Parse
Forward and Parse Backward to
navigate through all the traces.
In case of a local client UCCP log file, Snooper watches for
changes in the file. If the file changes, Parse
Forward is enabled, and you can view the recent additions without having to
reopening the file.
Protocol Message Viewer
As mentioned
earlier, Snooper can parse the protocol messages from the server and client log
files and then display them in a fashion that is easy to follow.
Message
Viewer is integrated with Trace Viewer. Trace Viewer (Traces tab) shows all the traces, while message viewer (Messages tab) shows only protocol
messages.
By default, the protocol viewer is organized horizontally,
with the message preview list on the left and the message display pane on the
right as shown in Figure 7. You can use the Toggle View option to switch to a vertical layout with the list on
top.
The following sections describe the features in the Message
Viewer part of the tool.
Figure 7. Protocol Message viewer
Message Preview
The message preview list (left pane) shows a status icon and
the timestamp, direction (in/out), to and from users, and the start line of the
message. Usually, each message is a protocol message sent. For some log types,
internal diagnostic information is also shown as a message but it does not
represent a protocol message.
You can sort messages by clicking the column headers in the
message preview list. Clicking a row displays the message in the display pane.
Right-click a row to display a context menu, where you can select the following
tasks:
- Mark the message by setting a flag so it stands out.
Find related messages. This applies a filter for
that message's Call ID.
- Copy the full contents of the message to the
clipboard. - Go to the nearest entry in the trace viewer, so you
can view the event in the vicinity of the current message can be analyzed. - Clear search and keep the selection on the
currently selected message. (This is the same as the zoom in functionality
described for the Trace Viewer.)
The color of a message's row in the message preview list can
be used to quickly get information about the message. The following color
scheme is used:
- Green indicates a message that has been marked.
Dark red indicates an error message.
- Bright red indicates an error with the same Call
ID as the selected message. - White indicates an incoming message.
- Bright yellow indicates an incoming message with
the same Call ID as the selected message. - Gray indicates an outgoing message.
- Dark yellow indicates an outgoing message with
the same Call ID as the selected message.
The following symbols are used to indicate information:
- "#" indicates a marked message.
"\!" indicates an error message.
- Arrow labels indicate the direction of the
message. Left arrow indicates an incoming message. Right arrow indicates an outgoing
message.
Display Pane
The display pane (right pane on the message viewer) shows
the currently selected message from the preview list. The entire text of the
message is shown and is formatted to distinguish headers and body portions of
the message. The colors used for formatting can be changed as shown in Figure 8.
Figure 8. Global options
When text is selected in the display pane, you can copy that
text to the clipboard, search for other messages with the text, or add the
selected text to the current search.
Search Box and Toolbar
Above the message preview list and the display pane is a
search box and toolbar. The toolbar offers easy access to commands from the
menu.
You can enter search terms, separated by spaces, and the
message preview list will show only messages that containing all of the search
terms. By default, the entire text of the messages is searched. You can also target
your searches by using search commands. For example, you can search only the
TO or FROM fields or only at the message start line. For more details, see the
Search Reference section later in this document.
If text is enclosed
in quotes (" or "), the search treats it as one term, Search commands are not
processed inside quotes. If you want to search for a term that contains quotes,
surround it with back quotes.
Search commands are specified in the form
"command:value" (the command name, followed by a colon, followed by a
value string). These search commands are used to narrow the scope of the search
to particular fields or properties of the message. The value may be a quoted
string or just a simple word. The complete syntax for search commands is provided
below. As an example, the search string, "direction:out
to:someone@example.com 'some text'", searches all outgoing messages
addressed to someone@example.com containing the phrase, "some text".
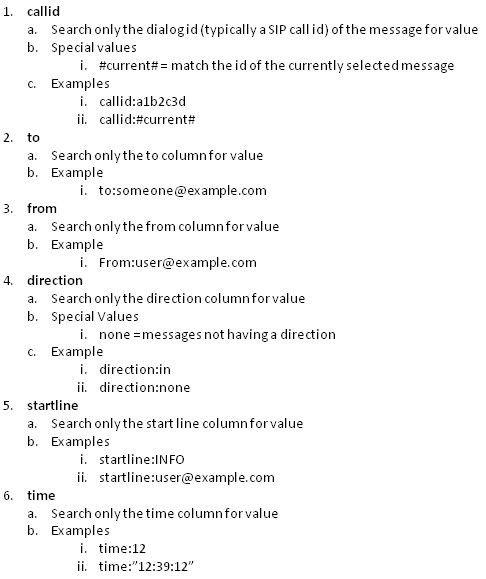
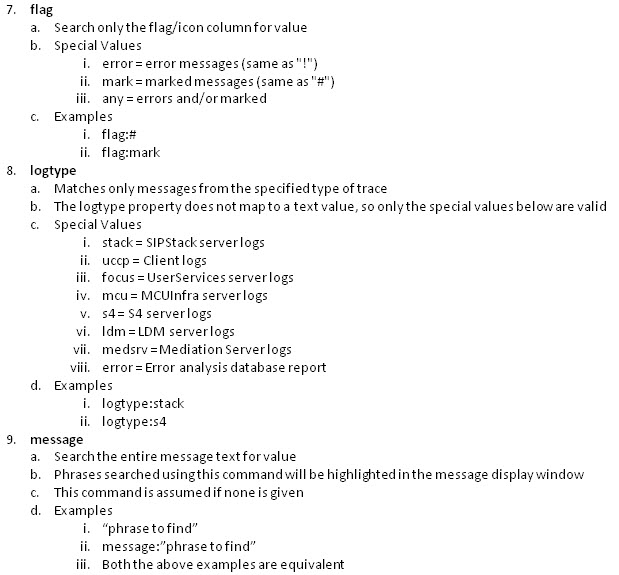
Search Reference
The following commands are valid only for the search box
when the Messages tab is active (and
not for the search box that is shown with the Traces tab). Text search is supported only when the Traces tabs is active.
Database Reports
From the Reports menu, you can access three types of
database reports. For each report type, you will need to specify the pool
backend database instance to query as well as parameters appropriate to the
report type. The types of supported reports are:
- Error analysis
- Conferencing and presence
- Stored procedure error analysis
Each Type of report will be examined now.
Error Analysis Report This
report lets you connect to a Monitoring Server backend to review automatic
problem reports generated by client programs. You will need to specify the Monitoring
Server database instance and database name to load the problem reports. You can
review reports by user or problem type and specify a date range. Each problem
report appears as a message.
Conferencing and presence reports The
second type of database report is the conferencing and presence reports. This
is a set of several different report types that load as text.
Note.
For Standard Edition servers, the backend database might not be reachable
remotely. In such cases, run Snooper locally on the Standard Edition server.
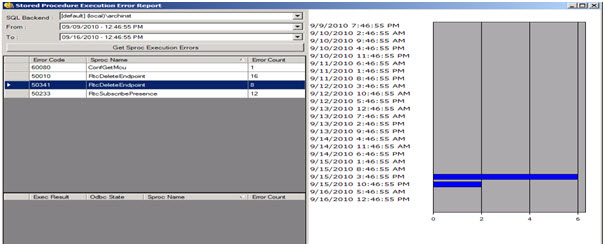
Stored Procedure
Execution Error Report The third type of report is the
stored procedure error analysis report. This report lists stored procedure
execution errors over the specified period of time and facilitates drilling
down into each error type and viewing the error occurrence pattern in a bar
chart as shown in Figure 9.
Figure 9. Stored procedure report
Output
Snooper can be used to view traces in server and client UCCP
log files.
Purpose
The purpose of this tool is to enable easy analysis of trace
files and provide an easy interface for showing error reports, and conferencing
and presence reports.
Requirements
This tool requires .NET framework (version 3.5 SP1) to be
installed.
Summary
In this document, we went over the various features of
Snooper, and saw how it can assist in debugging Lync Server-related issues. The
most important functionality of Snooper is its trace and protocol message
viewing capability, but its database report feature can also come in very
handy.
Lync Server Resources
- Lync Server 2010 documentation in the TechNet Library
- NextHop blog
- Lync Server and Communications Server resources
We Want to Hear from You
Keywords: Snooper, trace, log, analysis