SCOM and Power View: Performance Forecasting in Power BI
If one built a short-term performance model for SCOM and converted it to long-term, then one might want to apply predictive analysis to it. Power BI provides a way to use forecasting models. I will go through the steps to get the model and views ready for forecasting as well as a simple analysis. "Introducing new forecasting capabilities in Power View for Office 365" describes more about the controls and limits.
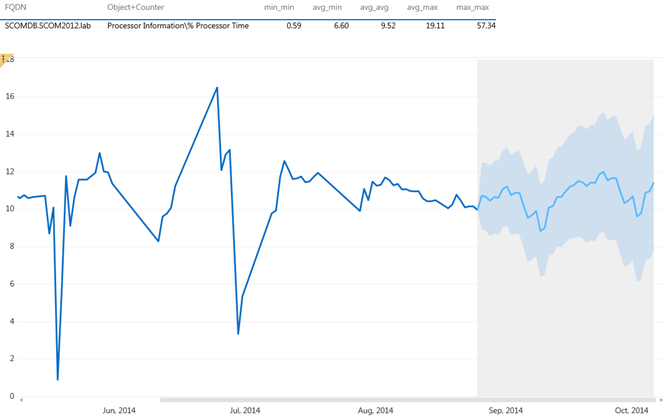
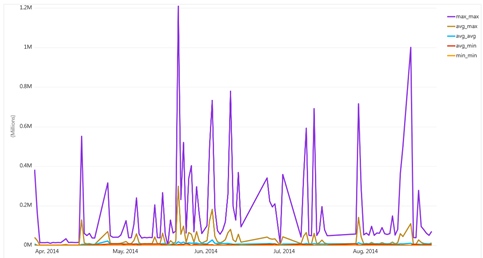
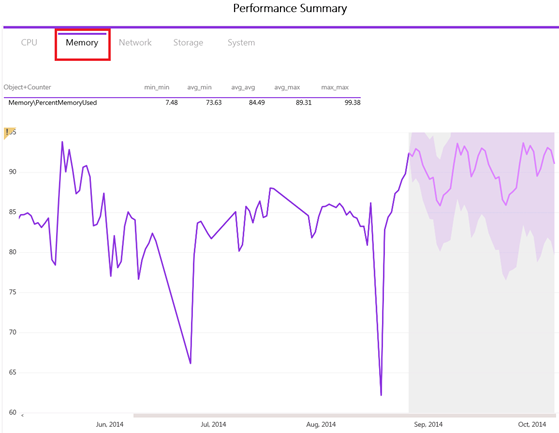
This view shows a forecast for CPU utilization for a single server:
Overview
A. Prepare the Data Model for Power BI
B. Modify a Line Chart in a Report View
C. Configure the Forecast
Step by step
A. Prepare the Data Model for Power BI
Upload the data model (the workbook size for processing has an upper limit of 250MB as of this writing)
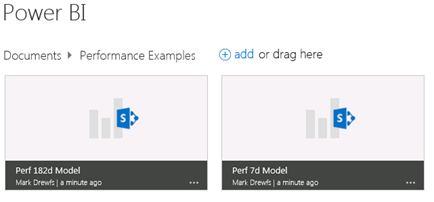
Go to your Power BI site and navigate to the workbook location
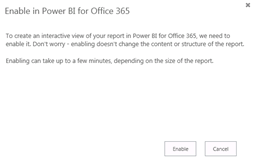
Click … then click Enable for the data model
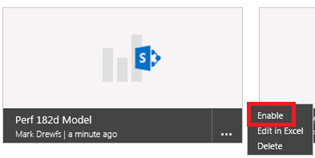
Click Enable
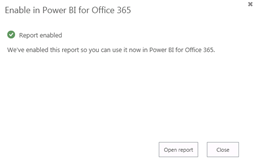
After the report has been enabled click Close
Add the data model to Featured Reports if desired
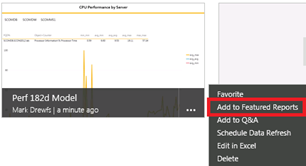
Click on the data model to open it
Click on the HTML5 version of Power View in the lower right corner

Hover over the green arrow in the upper right corner

Click Explore the data

B. Modify a Line Chart in a Report View
Select the report view for forecasting from the tabs on the bottom

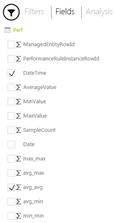
Select the line chart
Reduce the number of lines to one by unchecking values or the legend field
C. Configure the Forecast
Click Analysis

Select the line chart
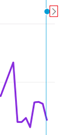
Click on the right arrow to expand the forecast
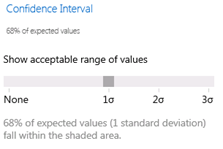
Change the Confidence Interval to one standard deviation
Select different tiles to see the forecast applied to the rest of the view
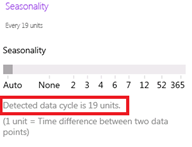
Review the automatic Seasonality value to see the detected data cycle
Hover over the exclamation mark in the upper left of the chart to see warnings