Tips and Tricks: How to determine how many connections are coming into each protocol on a server
Have you ever wondered why one server or a set of servers seems to be more utilized than others and can't figure out why this is occurring? Well, some of the time this boils down to the environment not being evenly distributed for all the requests coming into the environment, or on the backend of Exchange where we have a heavy set of users or mailboxes that are more active than others. We can't fully rely on TCP connections because we can't break it down enough to determine what type of protocol is causing those TCP sessions. Luckily, we are able to determine how many requests we are executing on each Application per Site. Which in the Exchange world for 2013 and newer, by default we have 2 sites one for the CAS role and one for the Exchange Back End for the Mailbox role. Under each site in IIS, we have Applications that are broken down for different services or protocols the Exchange uses. Because of this breakdown, we are able to utilize the counters "\ASP.NET Applications(*)\Requests Executing" to determine how many requests each Application it is currently executing on the server.
Now way back in the day when Exchange 2013 was first released, most of the Applications were using the same Application Pools which made troubleshooting hard when we were trying to determine which piece of Exchange was causing the issue (CAS or Mailbox role). Now it is a little easier to determine, but these counters are still useful to help determine proper distribution of load within the environment.
In order to determine the load within the performance data, load up the counter "\ASP.NET Applications(*)\Requests Executing" with the instance that you mainly want to look at. For this example, I am going to use MAPI.
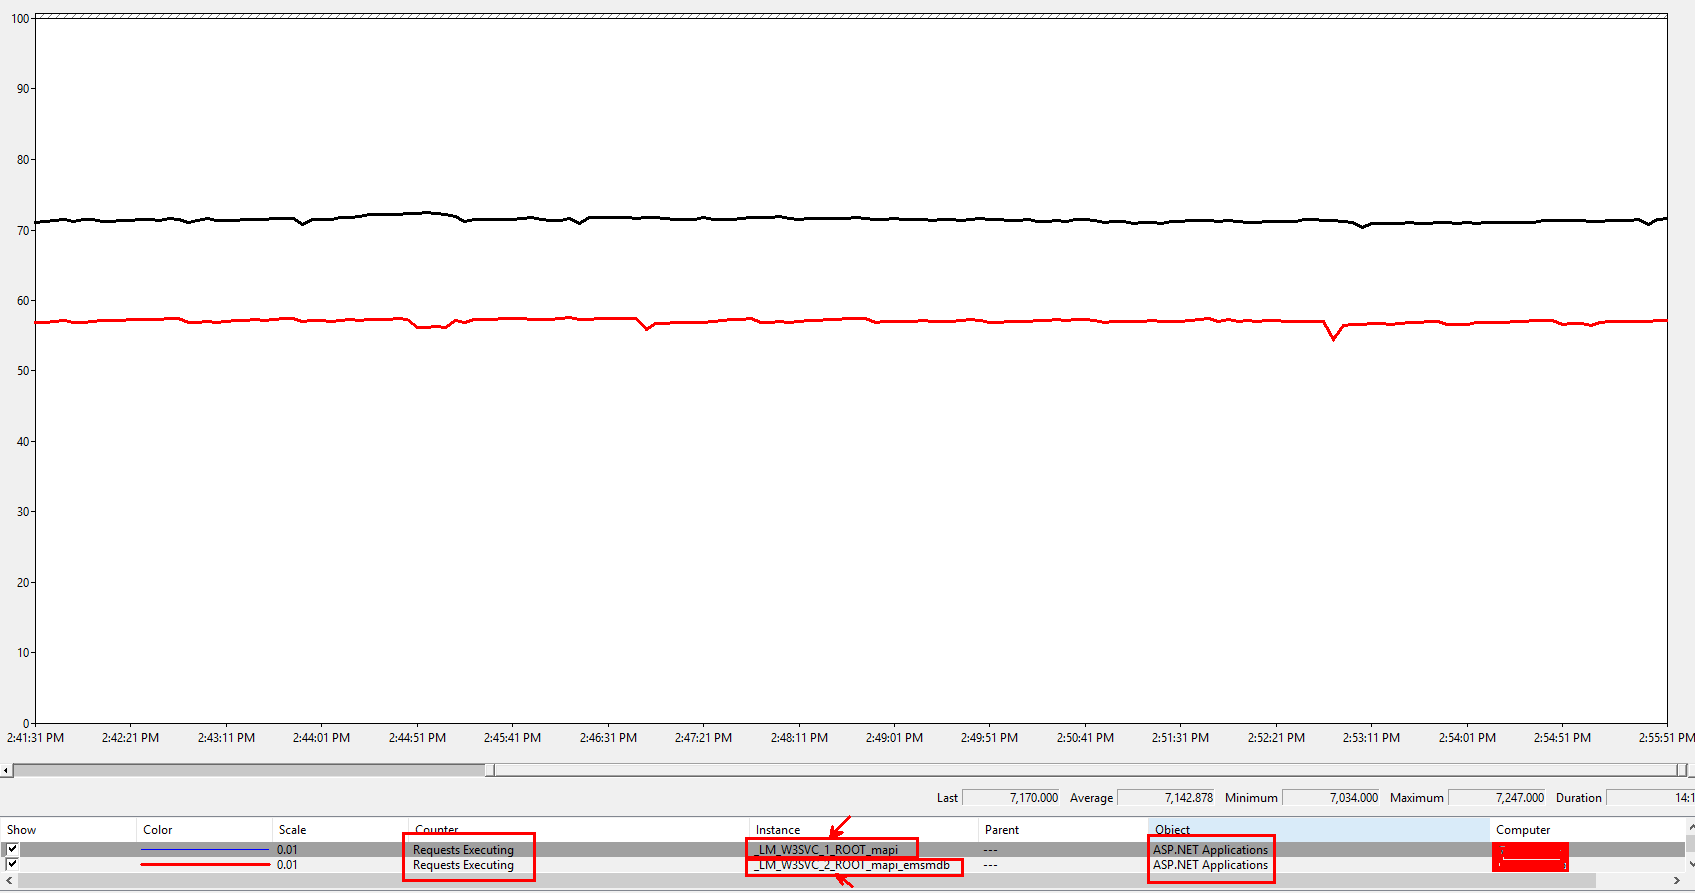
In the image above, we can see that we are looking at two different Instances, "_LM_W3SVC_1_ROOT_mapi" and "_LM_W3SVC_2_ROOT_mapi_emsmdb". Whenever you are looking at the Instances in this counter, the number value correlates to the Site that this Application is associated to. Typically, the protocol is going to be the same in Site 1 and in Site 2, but MAPI is a little different and we hit a different naming convention in the backend or mailbox role of Exchange. Here is a snippet of the instances that you should see in your performance data for Exchange.
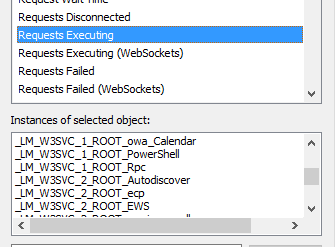
Keep in mind that there can be some customization done to Exchange to have added a 3rd Site so you could see a number "3" in the mix as well. So keep an eye out for that as a possible cause of an issue with load balancing as well.
From this set of counters of data, we can properly determine how many connections we are executing on each protocol. This allows us to determine if there was a large increase or decrease of requests and we can go from there to determine why that might have occurred. These set of counters are a better use to determine load balancing from a frontend connection as well as a backend connection. Normally admins will try to keep an equal number of users across on the databases, which is typically good till you mix in extreme users. For example, if you have users that are connecting to multiple mailboxes for a different reason, or better yet you have all your modern public folders on 1 server with normal users, we can see a dramatic difference in connection count on the backend connection of the server. The number of requests executing is going to give you a better representation of how busy this server is compared to another.
Now, from this set of data, you can only determine if we all of a sudden had a spike or dip in Executing Requests of this server. So that doesn't provide us useful information of load balancing of the environment until we add preferably all the servers that are behind the NLB to the view to determine if there is a major difference in connections to each server. You can do this by adding the performance data from each server during the same time frame and pulling them up in the same view. When wanting to add the other server, you just need to select the drop down under "Select counters from computer:" and select the computer that you want. Then you can proceed to add the same set of counters and then compare them.
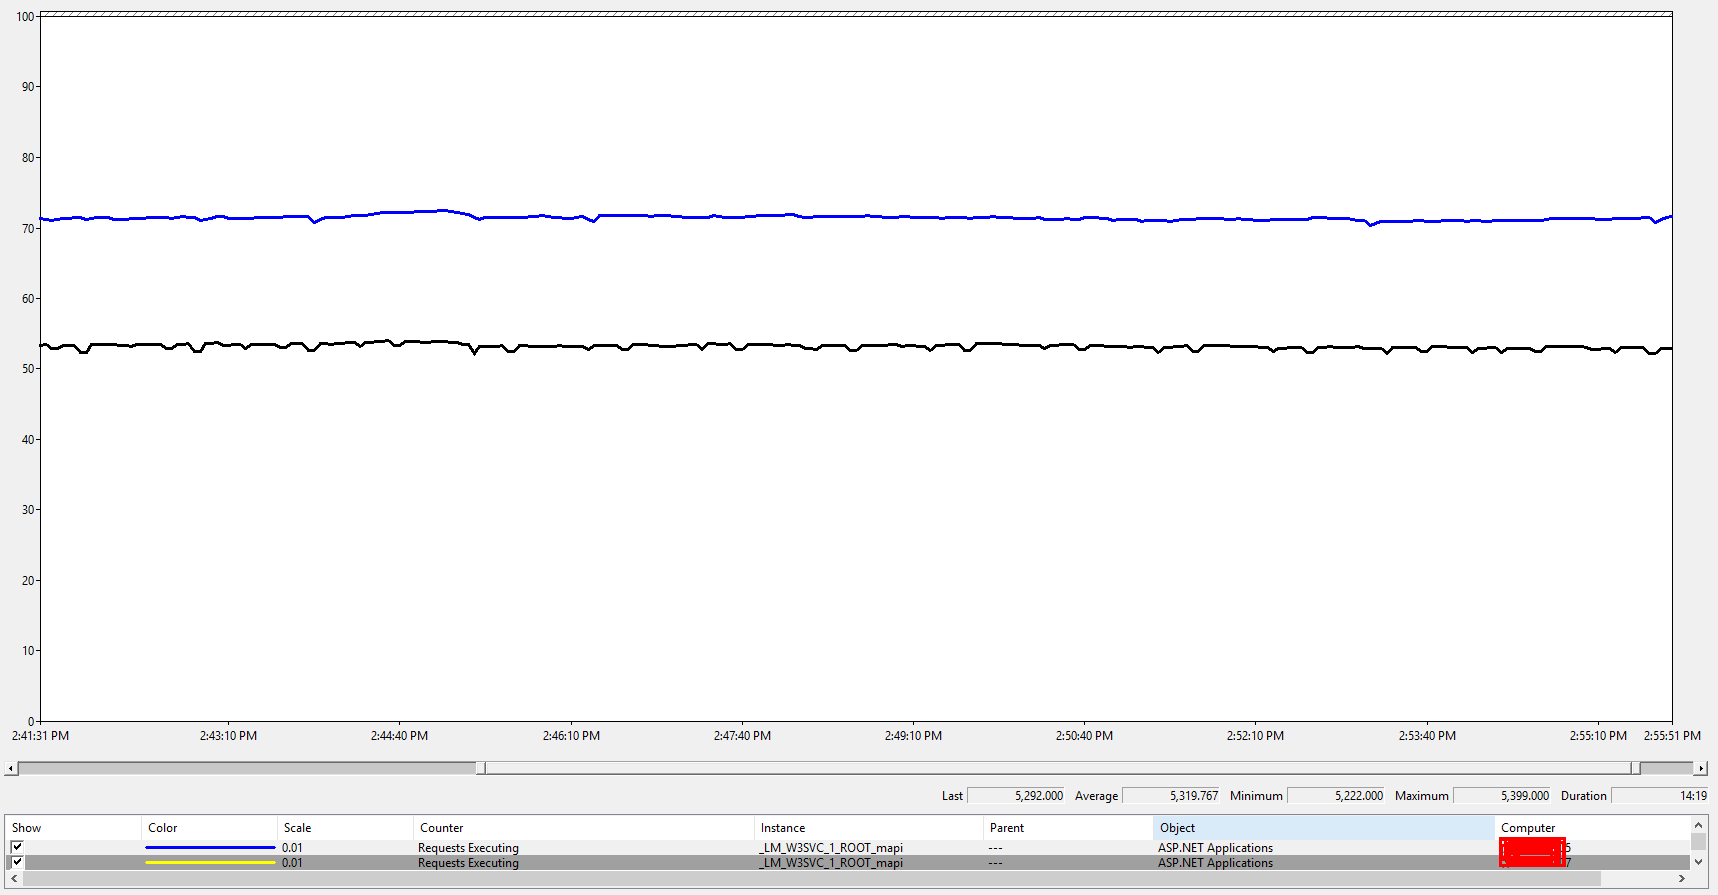
From this image, you can see that server number 5 is averaging about 7,000 for the frontend connection from the NLB and the server number 7 is only averaging about 5,000. This is a large difference that could be adding to the additional load on server 5 in comparison to server 7. Keep in mind that the CPU usage on a frontend connection should be extremely small in comparison to the mailbox role. However, even with lower CPU usage in a good environment, we shouldn't see about 2,000 difference in connections if the NLB is configured to evenly distribute the load.
You can also take the same concept from above and apply it to the backend connections that are getting proxied to this server from different front ends. This will allow you to see if you are evenly distributed between all the server nodes.
One key concept to keep in mind when looking at data is that you need to understand that these counters can be different from environment to environment, as to what we should be seeing and where a server can't handle any more of these types of connections. The limit values are going to be factored based on the mailbox profiles and the benchmarks of the server's performance capabilities as well as many other factors that can consume resources on the server. This is yet another reason why you need to be looking at performance data from multiple servers if possible even servers that aren't seeing the issue that is under the same load. By collecting this data, you can get a better analysis done by being able to do the comparison between servers.