How to troubleshoot Exchange Performance Issues at a basic level (Part 2)
In part 1, I went over information that you needed to collect when you are suspecting an Exchange Performance issue within the environment. In this part, I will be going into depth of the Key Pointers when looking over the Data.
Knowing the Min, Max, and Average for a duration and an interval that matters
The reason why you need to know what your Min, Max, and Average are because this data can easily be skewed if you are not looking at a reasonable duration and timeframe for that capture. What I mean by this is that we typically try to capture performance data of about 8 hours during production hours, but we might only be seeing issues during part of the day. We don't care what the average is for the whole 8 hours of the capture, but smaller chunks of data when the issue was occurring. In order to get a good understanding of what is going on in those smaller timeframe windows, we need to have a lot of data points to paint a better picture. This is why we recommend collecting performance data with at most a 5-second interval. What I would suggest is a good average timeframe to get a better understanding of an issue is going to be from 5 - 20 minutes. Keep in mind that the timeframe window that you want to look at can dramatically change from issue to issue depending on the counter and how much higher than the recommended threshold value that we provide for that counter. Here is an example of what I am talking about.
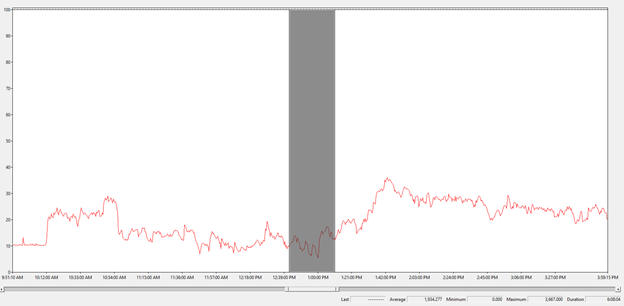
One of the biggest problems we had with Exchange 2013 was with Garage Collection (GC) within .NET. GC is basically .NET freeing up memory within a process. In order to identify this issue, we use the counter "\.NET CLR Memory(process)\% Time in GC" to see if the average is above our threshold of 10. Here is part of a data collection that we got from a server having an issue and we were checking for GC issues for a w3wp.exe process.
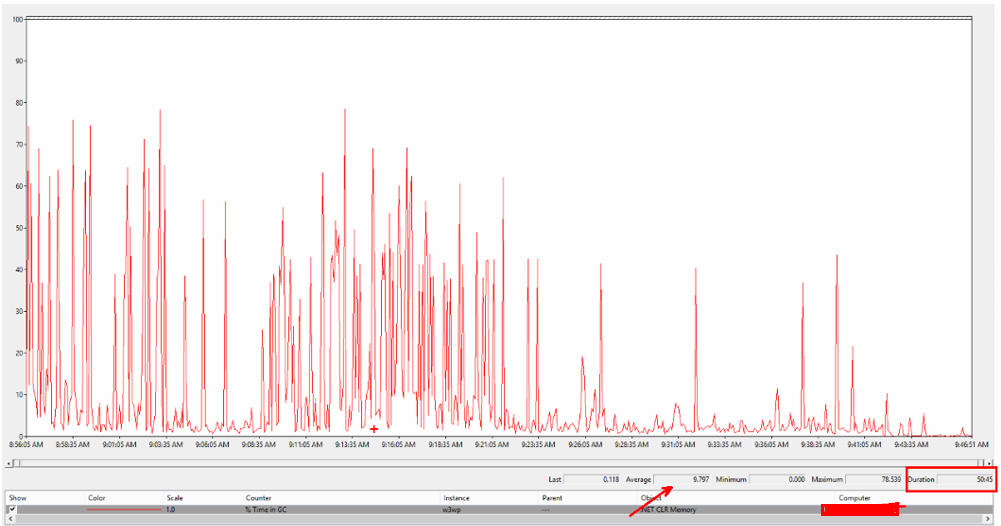
Here you can see that we have a Duration of 50 minutes for the file, and the average is below our threshold so this means that we are not hitting an issue, right? Well no, that is not the case this is a 50-minute capture and we can see the GC causing issues at random times, so we want to zoom into a more reasonable time frame to see if we go above this threshold.
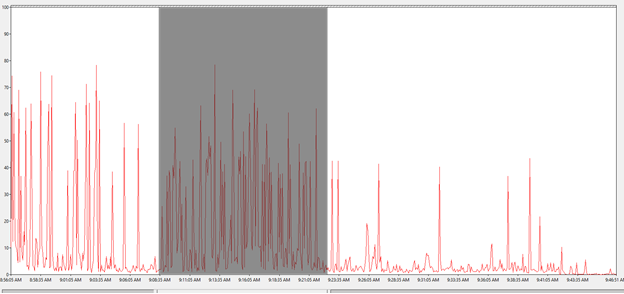
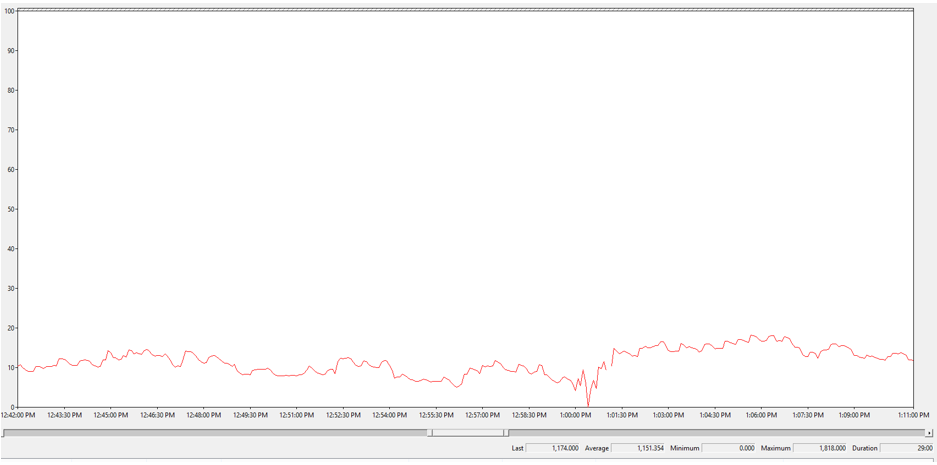
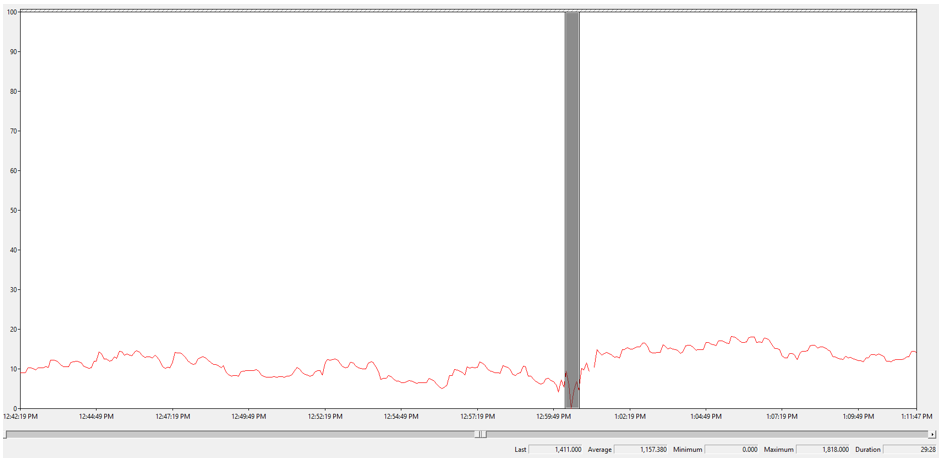
So, if we zoom into this area that I have highlighted below, we should get a better idea if we are seeing this issue.
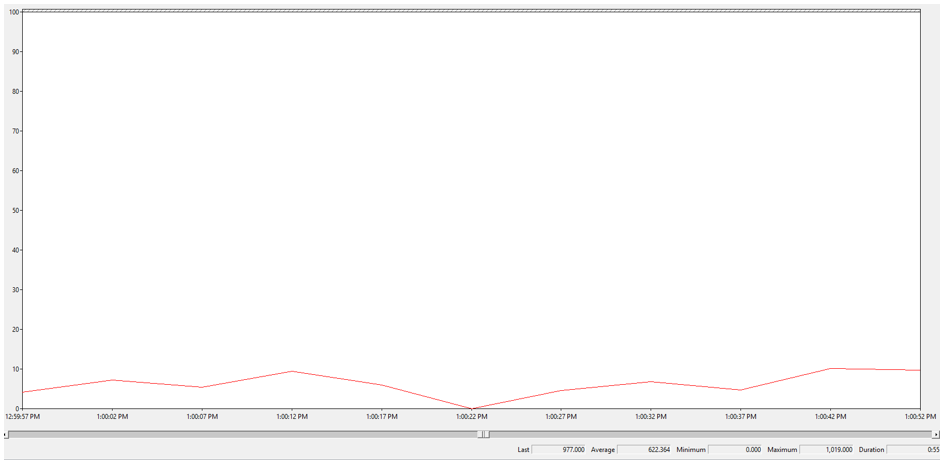
Now we can see the below image what our average is for that timeframe now.
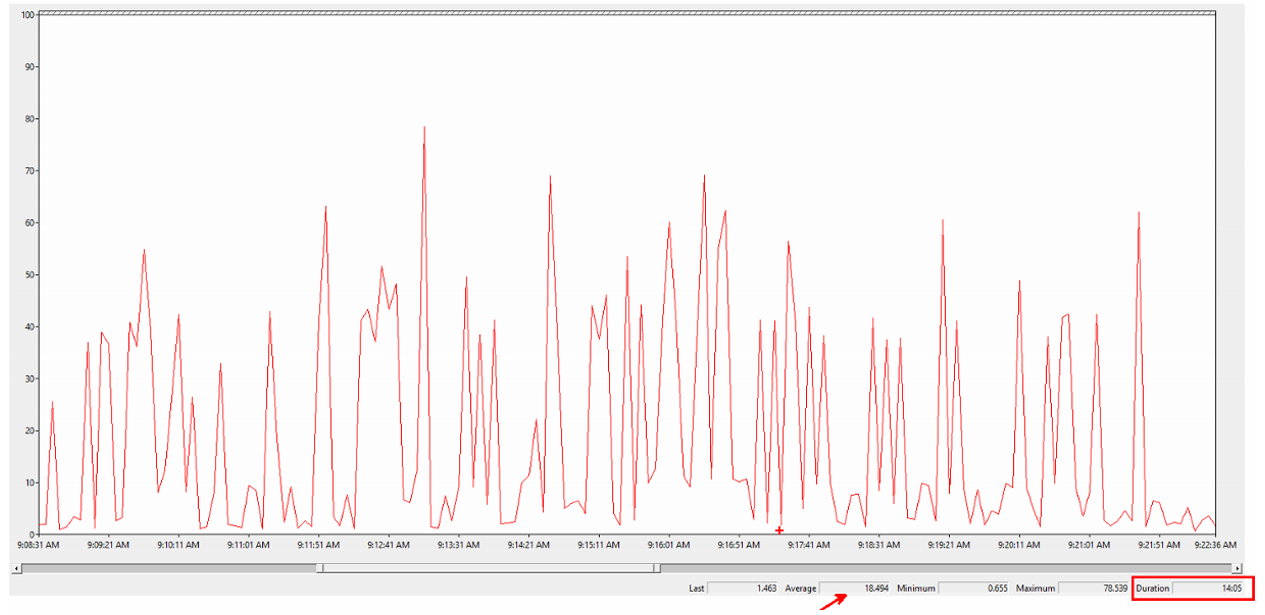
As you can see, we are hitting an average of 18.494 during a 14-minute duration. This could easily provide issues that you may be seeing with Exchange 2013 and you should install .NET Framework 4.5.2 if you don't have it already installed. For this issue, we installed .NET 4.5.2 and it fixed the issue that we were seeing.
Note: You should always have the latest version of .NET installed that is supported by the build that you are currently running for Exchange 2013/2016.
Note: This type of issue was more common with the earlier releases of Exchange 2013 prior to .NET 4.5.2 was ever released.
Another example of why it is important to look at your Min and Max for the whole duration is to see if we are dramatically above or below the threshold for that counter. You can't always depend on the graphical view that you are seeing within Performance Monitor to see if we actually hit that threshold or not. For example, we don't want to see the counter "\Memory\Available Mbytes" ever hit 0. We would like to see it above 5% of the available physical RAM on the server, if possible. However, what you really don't want to see is it dipping below 1GB as you are causing the system to work extra hard to try and free up memory from processes. In this view of my collection, this is what you see.
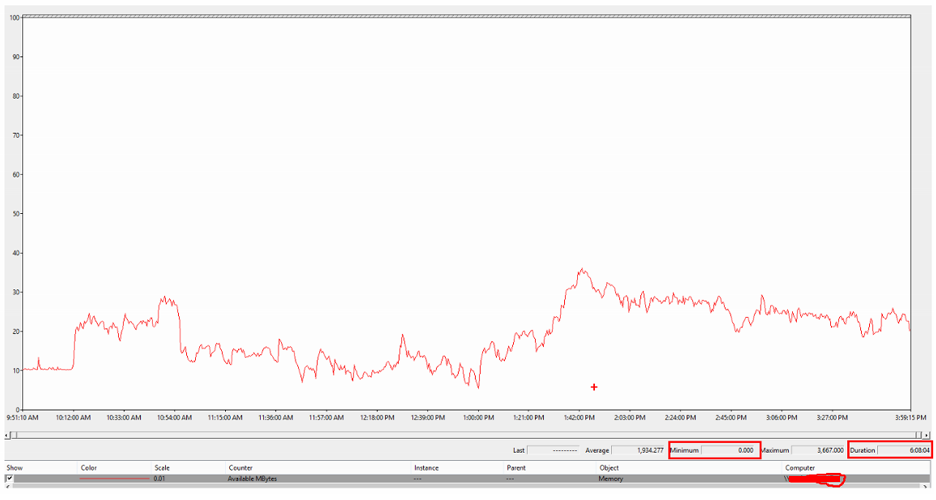
As you can see we hit 0 for a Min, but in the graphical view, we don't ever see the line even come close to the bottom. So, is this accurate? Most of the time yes, I have seen some issues if the data has been stopped incorrectly or has gone through relog.exe where the min is 0 and isn't correct but typically those data points are at the begin or end of the file. But most of the time it is correct, you just need to zoom into the lowest point of the line to see the issue. So if you zoom into this section of the data.
You now see this.
So now you can clearly see the line hit 0. Because of the long duration of the capture and the multiple data points in this collection, we can't display them all to the correct location that is visible to the eye without zooming in. This also brings up a good reason why to keep the intervals low, like at 5 seconds. If we were to zoom in more yet to this area, this is what you would see.
As you can see from all the data points, we are collecting this data at a 5-second interval. Because we are doing this, we are able to see that we do in fact reach a value of 0 for this counter. If we were to have a 1-minute interval capture, like what is default in the Exchange 2013/2016 data collector sets, it would just show that we got really low and only dipped slightly below the 1GB threshold limit. This is why we want to collect data at a 5-second interval so we can see issues like this. This is also why it is critical to also collect Experfwiz data and not fully rely on the default data collector sets in these versions of Exchange for complex issues.
Knowing what your scale factor of your counter is set to
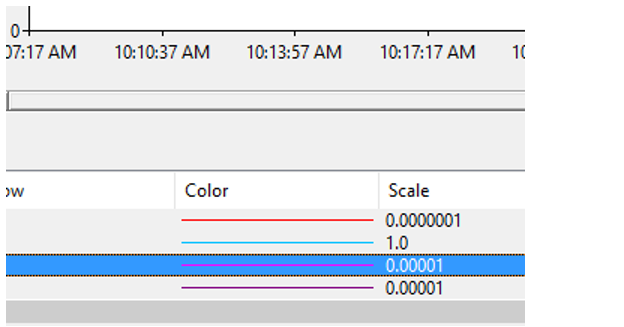
Knowing what your scale factor is rather important when you are dealing with counters that can dramatically vary in their values and when you are comparing them. So, the most common time I am aware of this is when I am looking at processes for the % Processor Time and Memory counters for those processes. Here is an example of what I am talking about.
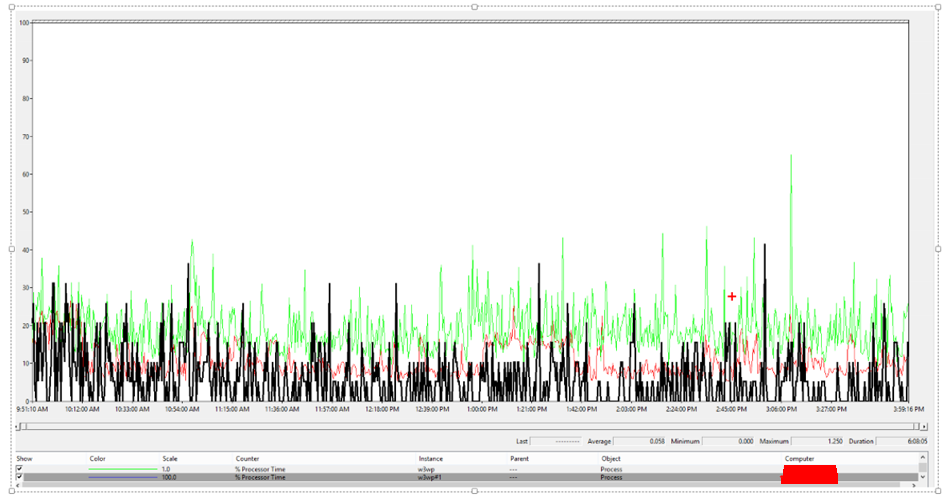
From this data, we can see that we have 3 processes showing within this view. Based on the lines in the graph, you would think that they are consuming about the same amount of resources, right? Wrong, they aren't using the same amount of resources as they are all at different scale factors. In this view, we have 1 counter at a scale factor of .1, another at 1, and another at 100. The one at .1 is consuming the most during this view of the performance data that we are looking at. Providing that you used the "Scale Selected Counters" feature in Performance Monitor, that is how you can get different scale factors for the same counter. What that means is when you scale a counter to size (Scale Selected Counters), it will automatically calculate this based on the Max value that is in your current view of the data. So, if you have a crazy high data point within your view, your data is going to look like it just has a little spike vs a major spike if the correct scale value isn't used. Here is an example of what I am talking about.
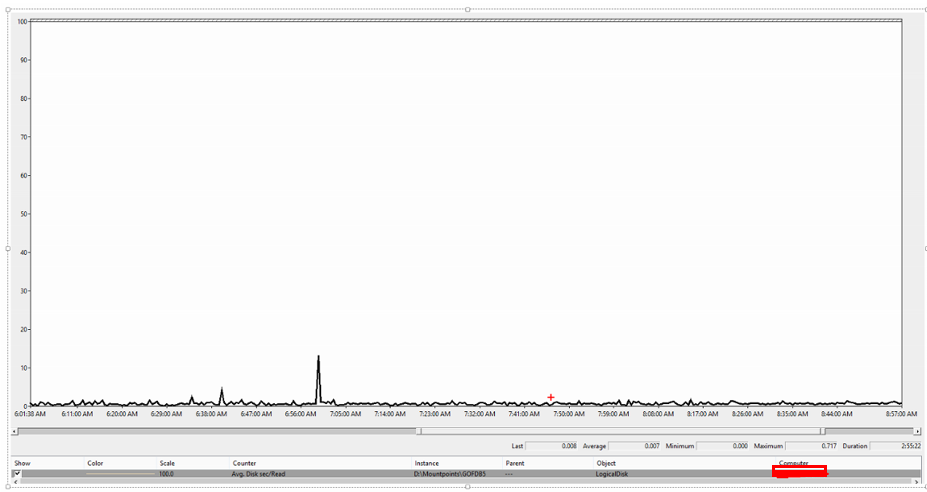
In this example, we can see that we just have a little spike on the "Avg Disk sec/Read" counter. At first, you think this is an okay spike because it maybe hits 20ms based on this view. But if you look at the Max value, you can see that we are really hitting 717ms during this spike. Since our scale factor is at 100 it really skews with our view of this counter. So, if we set it to 1,000 we can see that this is what we are looking at now - we set this to 1,000 because there are 1,000 milliseconds (ms) in a Second.
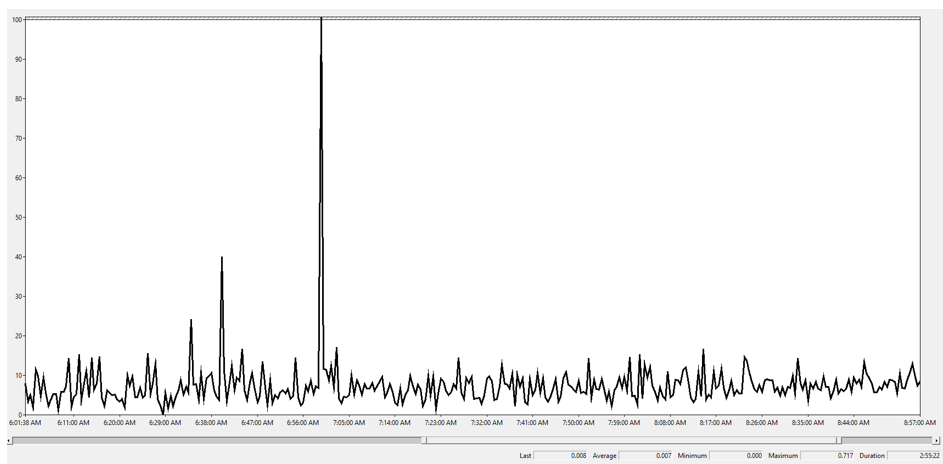
As you can see this stands out more than the other scale to what we are actually seeing. This is why it is important to be looking at the numbers as well as the graph when looking at performance data. This spike is so high (717ms) that it should really be noted and addressed by the storage team/vendor to understand why this I/O latency issue occurring. This should just be noted and isn't cause for extreme alarm (again depending on the issue that you are troubleshooting), as this isn't likely the cause to your full issue but it is an indicator that we might be pushing our disks at the time that we see that spike occur and we should never see a spike this high on an Exchange Server.
Knowing what we recommend for a threshold of that counter
Keep in mind that you must know which counter that you are looking at in order to determine if it is normal or within our threshold values. Also, keep in mind that you can't have a spike that is extremely crazy for a critical counter. For example, "Avg Disk Read/Write\sec" has always been 20ms or lower for an average. However, if you are seeing spikes up to 500ms, that can be extremely bad depending on multiple factors. It is also extremely bad to have some spikes of averages that are maintained above our recommended average, for an extended period of time. What I mean by this is similar to by the previous post regarding the .NET GC issue, we don't want to see a period of time that is greater than our threshold. The higher the maintained spike, the less time that you want to be above that.
For example with the "Avg Disk Read\sec" counter, I would be a concern if we maintained a 100ms average spike for about 60 seconds. I would consider that to be poor disk I/O latency, or getting to the point where we are having some issues keeping up with what Exchange needs. This is something that we need to keep in mind when we are seeing issues like this. Also, speaking strictly to the "Avg. Disk Read/Write\sec" counters, just because we see high spikes or averages on a particular drive, this doesn't mean that the disk(s) are bad. What this does mean, however, from the OS level prior to getting back to the application layer, we are seeing this as the Avg. latency for those I/O requests for that second. This could mean an issue with the drive, controllers, or just the path to the drive is where we are actually experiencing the latency. In a later post, I am hoping to get into this with a little more detail.
Here is a list of links for our guidance of thresholds for some of the counters that we offer in Exchange, and you can use the Exchange 2013 counters for 2016.
Exchange 2013 Performance Counters
https://technet.microsoft.com/en-us/library/dn904093(v=exchg.150).aspx
Performance and Scalability Counters Thresholds - 2010
https://technet.microsoft.com/en-us/library/dd335215(v=exchg.141).aspx
Monitoring Without System Center Operations Manager - 2007
https://technet.microsoft.com/en-us/library/bb201720(v=exchg.80).aspx
How to determine which Web Application Pool is which w3wp.exe process
For information on how to determine this from both the performance data and live on the server, check out my Tips and Tricks blog post that I wrote "How to determine which w3wp.exe process belongs to which Application Pool"
How to determine if you are in a balanced load from performance counters
For information on how to properly determine if you are evenly balanced for your connections on both the frontend connections and backend connections, check out my Tips and Tracks blog post that I wrote "How to determine how many connections are coming into each protocol on a server"