How to troubleshoot Exchange Performance Issues at a basic level (Part 1)
Over this next series of blog posts, I will be going over some of the basics of how to troubleshoot an Exchange Performance issue at a basic level and provide some key pointers that are needed to build on the foundation of analyzing performance data.
What we need to know
- What version of Exchange?
- What are the symptoms?
- Don't just provide high CPU, provide details like the Avg. high with the process that is consuming the most with what it is at like below.
- Example: Total CPU 95% - 100%, store.exe ~80%
- Don't just provide high CPU, provide details like the Avg. high with the process that is consuming the most with what it is at like below.
- What OS is Exchange running on?
- Does this occur all the time?
- Does this occur on all the servers?
- What have you changed recently? (This includes if you are in the middle of a migration. More mailboxes, more load)
- What 3rd party applications are you using? (backups, AV, Skype/Lync - even though it isn't 3rd party it still adds additional load to the servers, and users with multiple devices that use EAS, BES, or GOOD are not included in the sizing calculator etc...)
- Are clients in online or cached mode (provide a guess if possible)
Exchange 2013 and newer we need to get additional information
- What is the version of .NET installed?
- Are the servers All in One (AIO)? - Only with Exchange 2013
- What CU are we on, and are we on the same build for all the servers? (2013 and try to keep the servers in N - 1 for the builds)
- How many users are on the servers? Per Database?
- How many active and passive databases do you have? (Lot of cases that we have seen in the past is when we are undersized so this gets to be important later on)
Note: Most of the Exchange 2013 and newer additional and default information can be collected with our Health Checker Script, which you can download here.
If the Exchange Environment is virtualized, here are some additional questions that should be answered ASAP when dealing with performance issues.
- Do we have dedicated resources for Exchange (Memory/CPU)?
- What is the Processor of the host machine and are there multiple?
- How much memory is installed on the host machine?
- How many logical cores do we have presented on the host?
- How many physical cores do we have presented on the host?
- How many cores are assigned out to each guest machine, that is currently running?
Note: If you are seeing high CPU utilization on the Exchange guest machine, like 95-100%, the issue is likely not with the host or its configuration. Reason being is we are getting all the resources that we are allowed extremely quick that is allowing us to actually see an extremely high CPU usage on the guest machine.
Note: If you have Exchange virtualized and is acting extremely slow within normal RDP usage and other funcationality but aren't seeing a High CPU usage, begin to question the host configuration as it may not be setup correctly.
What to do when you first think the issue might be related to Performance
We need to have performance data to troubleshoot a performance issue, and the quicker we get it the better. By collecting performance data, it provides evidence of the issue that is occurring and history of data that we can later go back to and compare against. I personally like to provide a comparison of before and after to show how much we have improved after making a change to the environment, other than relying on the end user's feedback to a problem.
When collecting performance data, we should start to collect it from all the affected servers if possible or at least from about 4 servers to allow a proper analysis to occur. If possible, we should also collect from some servers that do not have the issue as well, that are under about the same amount of load. By collecting the performance data from the other servers that are not having the issue, we are able to use them as a baseline during the same time period to compare against the affected servers to allow a better analysis to occur. So, we should start off by running the following command with the newest Experfwiz, even if it doesn't say stable always run the newest unless you run into issues. Reason being is typically the newest one has all the latest counters added to it that we utilize for analysis.
$location = "C:\location_of_performance_logs\"
.\experfwiz.ps1 -filepath $location -interval 2 -ExMon -ExMonDuration 00:20:00; sleep 1260; .\experfwiz.ps1 -stop; .\experfwiz.ps1 -filepath $location -interval 5 -quiet
Note: The Exmon switches may not be needed in every scenario, but it is better to include them to rule out a single user or a group of users causing the issue vs needing to go back and collect that data again when the issue does occur to rule out that possibility.
Note: With the experfwiz script we have the option to add -Threads. This is typically not needed to troubleshoot a performance issue right off the bat. It provides a lot of additional information that will add more I/O overhead to write this out and increase the amount of blg files. This information is also more useful with additional debugging information that is being collected synchronously.
By running this single cmdlet in Exchange Management Shell (EMS), it will automatically stop after 21 minutes and start up a new collection with the 5-second interval for the default time of 8 hours. Which may not be needed but it still allows us to collect data while we are looking into the issue. You should do this so you don't have to worry about stopping the collection after 21 minutes and starting up a different one. By collecting a smaller chunk of performance data when the issue is occurring, it will allow us to begin our analysis to get a better understanding of what is going on with the system. While we are waiting for the 21 minutes to be up, we should still be utilizing the time by either looking at performance data live, or application and system logs, and collection additional information about the environment. However, we still want to continue collecting the performance data as the 21 minutes is not enough to properly determine what is going on with the system. Keep in mind that this also might not provide the most accurate information, as we could be looking at sub-symptoms that are a side effect of what occurred prior. The best source of data to determine what is causing the performance issue is performance issue leading up to the start of the issue plus 20 minutes into it. With Exchange 2013, we can get a better idea of what is leading up to this initial issue if we also look at the daily performance logs.
Note: There are articles regarding how to disable the daily performance logs on a system, do not do this. The best source of information on getting a Root Cause Analysis of an issue that is no longer occurring are these logs along with some other default logging that is enabled.
How to look at the raw data
In this section, we are going to determine the best way to read the data that is collected with experfwiz, as it is the best way to understand everything that is going on with the server all at once. We could use the tool PAL, but you still need to understand how to read it properly in order to make sense of it and look over counters in comparison at the same time.
How to open a BLG file faster
Most people would typically just double click on the .blg file and wait for it to open up in Performance Monitor, and this process takes forever to load when you are trying to open files greater than 512MB. There is a faster way to look over the data and here are the steps:
- Open Performance Monitor
- Under Monitoring Tools, select Performance Monitor
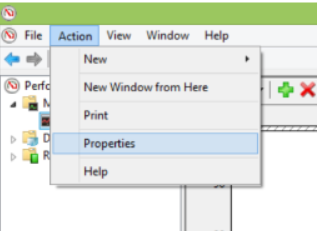
- Then select the Action tab at the top, then select the Properties option
- Then in the new window, select the Source tab
- Under Data Source select the Log files option
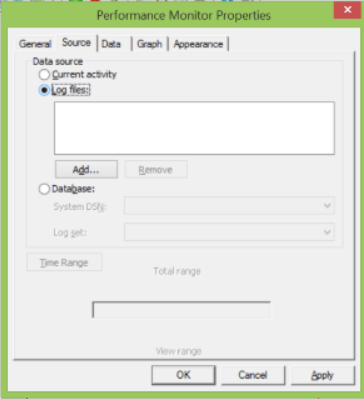
- Browse to the location of your performance file and click Apply
By following these steps you will be able to open up a .blg file much faster than just trying to double click on it, and it also allows you to add multiple files to show you a much bigger time frame. This is great if you have multiple files because of the roll over on the max size that you have from the Experfwiz or are just looking at multiple servers.
Key pointers when looking over the data
When looking at the performance data, there are some factors that really matter when you are reviewing it.
- Knowing the Min, Max, and Average for a duration and an interval that matters
- Knowing what your scale factor of your counter is set to
- Knowing what we recommend for a threshold of that counter
- How to determine which Application Pool is which w3wp.exe process
- How to determine if you are in a balanced load from performance counters
For the next part 2 of this blog post, please continue by clicking here.