An approach of collecting and analyzing SCOM 2012 SDK connections
Knowing WHO logged on to SCOM WHEN, from WHERE and HOW LONG this session lasted can be very helpful information for SCOM Admins.
As we have a recommended limit of simultaneous open Operations consoles of 50 (details see here) it is also very useful to know the total amount of connected users in your environment at any point in time.
This blog post describes a possible way to answer these questions by collecting the available raw data via PowerShell and SCOM SDKm, transform it and analyze the result with Excel pivot tables.
Background information
Out of the box SCOM 2012 only provide some raw data to answer these questions:
There is of course the SDK connection counter, provided by the “System Center Operations Manager Data Access Service Monitoring” MP. Unfortunately the collection rule “Collects Operations Manager Data Access Service Client Connections” has an issue with PerfCounter instances.
My colleague Daniel has written an excellent blog article about it here including an example MP with an improved collection rule.And there is the SDK method GetConnectedUserNames() which provides us with a list of all currently connected usernames:
((Get-SCOMManagementGroup).GetConnectedUserNames() | Measure-Object).count
Unfortunately, the method only returns user names as strings and no further information.The Operations Manager Eventlog on each Management Server contains all log on (ID 26328) and log off (ID 26329) Events.
The challenge is, neither method give us the total amount of sessions for all Management Servers in the Management Group nor the duration of each session etc.
Collecting the data
So we have to combine the available information and modify it to suit our needs. Let’s have a look at the available events:
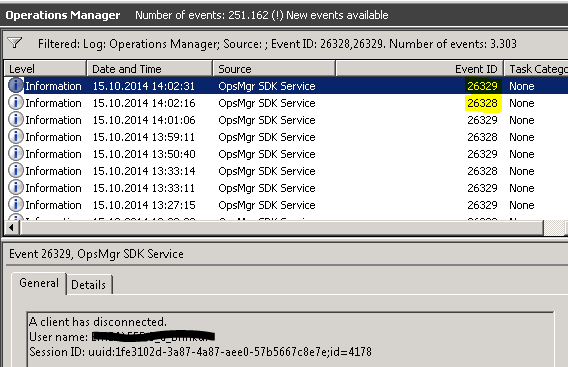
These events provide us with this information:
- EventID 26328: Logon Event, written for every new SDK session (Console or Shell)
- EventID 26329: Log off Event, written for every new SDK session (Console or Shell)
- SessionID: Unique ID which allows us to connect log on and log off Events
- UUID: Unique ID of the connecting Management Server
- ID: consecutive number of the session for the Management Server. It starts with 1 and increases until the SDK service will be restarted.
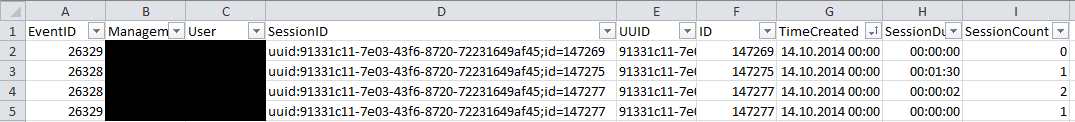
You can use this information to create a daily export of all your 26328/26329 events into a CSV file for later analysis:

This csv file should contain:
- EventID
- ManagementServer Name
- Username
- SessionID
- UUID - extracted from SessionID
- ID - extracted from SessionID
- TimeCreated
- SessionDuration -calculated Time between log on and log off Event
- SessionCount – calculated cumulated counter of all current sessions
An example script for collecting this data across all Management Server and storeing it into a csv file will be uploaded to the Technet Script Gallery soon.
Yes, there are design flaws in this approach :-)
If you create daily files, you will have an unknown amount of already open sessions at the beginning of the day and a certain amount of not yet closed sessions at the end. So your SessionCount will be lower than the cumulated values from the “Client Connections” performance counters of all Management Servers.
But when you analyze e.g. weekly data instead of daily, you should get very good results.You cannot distinguish between PowerShell SDK connections and Operations console connections. Unfortunately this is by design and I am not aware of a way to mitigate this problem.
Analyzing the data
Once you have collected the raw data, you can import it into Excel and analyze it with pivot tables:
I want to give you some examples on how to analyze the data and what results you can get out of it:
Pivot table: Daily sessions by Management Server
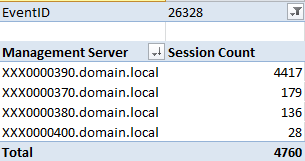
The 390 Management Server has to deal with most of the sessions. Who causes this? Let's have a look...
Pivot table: Daily sessions by User
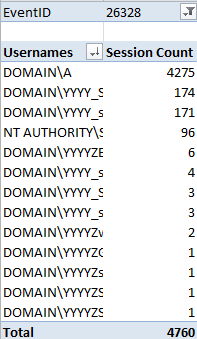
Now you can see, that user Domain\A is the one causing the most sessions. The reason is simple: this is an Orchestrator user which connects to SCOM every ~30 seconds.
Pivot table: Session Duration by Minutes
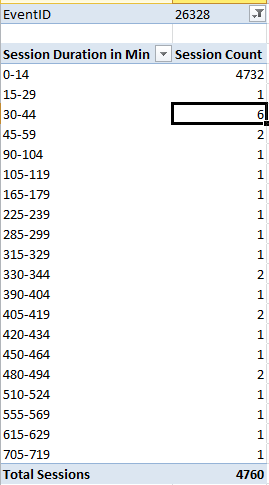
From this table you can see, that most sessions will be closed in max. 15 minutes. Only few sessions are lasting longer than an hour.
Hopefully this approach can help you analyzing the consumption of your SCOM SDK connections a little bit better.