Analyzing SCOM 2012 Alert logging latency
Periodically having multiple Alerts in the SCOM database with latency above 1 minute is usually a sign of a serious performance problems with either the core SCOM infrastructure (database, Management server etc.) or with specific agents.
This post focuses on finding the agents causing the delayed alerts by executing these steps:
- Step 1: Checking, if your environment has Alert logging latency issues
- Step 2: Gather detailed data for further analysis
- Step 3: Analyze the data
- Step 4: Checking the Agents
This post will end with the most common causes found on the Agent side which can cause Alert logging latency.
Background information: What is Alert logging latency?
Each Alert record in the SCOM dbo.Alert table contains multiple timestamps. The most interesting ones in this case are TimeRaised and TimeAdded:
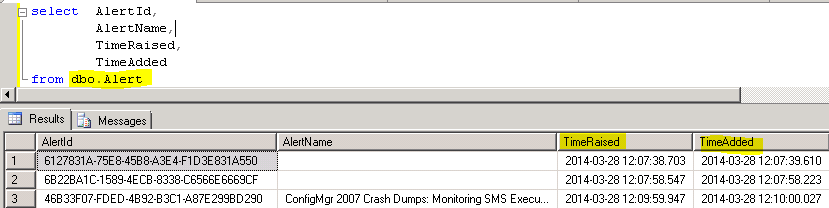
- TimeRaised
Timestamp, created when the Alert is raised on the agent. - TimeAdded
Timestamp, created when the Alert is written into the OpsMgr database.
Please note: All SCOM timestamps are in UTC.
The difference between TimeRaised and TimeAdded is called Alert logging latency.
Step 1: Checking Alert logging latency
In a well performing SCOM environment there should never be a big time difference between TimeRaised and TimeAdded. You can always check this with the SCOM Alert logging latency report (https://technet.microsoft.com/en-us/library/bb381330.aspx).
In a perfect world, the report should show 100% of the Alerts under 1 Minute latency:
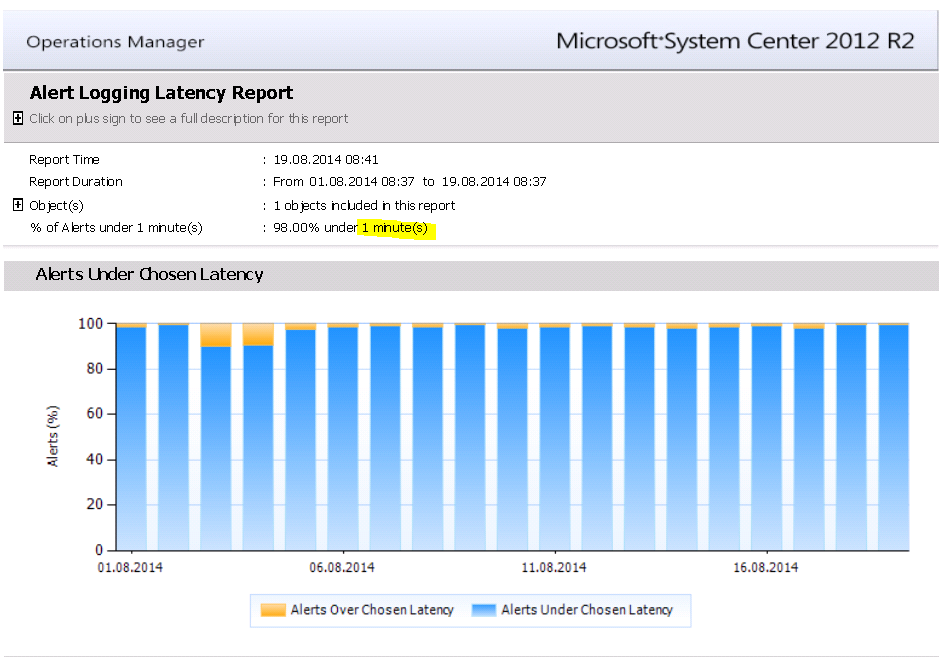
In this case you can see that there are 2% of all Alerts above the latency threshold of 1 minute. To further investigate the latency you can use this query:
SELECT AlertID,
TimeRaised,
TimeAdded,
DATEDIFF(minute,TimeAdded,Timeraised) as TimeDiffInMin
FROM [dbo].[Alert]
WHERE
DATEDIFF(minute,TimeAdded,Timeraised)>= 1
order by TimeDiffInMin desc
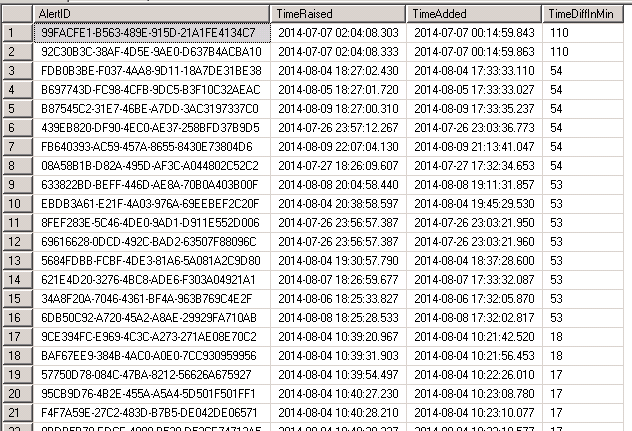
Looking at the time difference in minutes you can see huge delays up to 110 minutes. This is a serious issue and should be further investigated.
Step 2: Gather detailed data for further analysis
To find the root cause of the issue you should ASK yourself:
- Which Alerts are causing the issue? Only specific Alerts?
- Are there specific daily timeframes when these Alerts are raised?
- Which agents are causing the issue? Do these agents all report to the same Management Server (maybe pointing towards an issue on this Server)?
To further analyze the Alerts I have created a short helper function get-scomalertlatency (the function is attached to this post) which extracts all Alerts with latency greater than x minutes.
With this function you can quickly gather the necessary data:
PS C:\> $result= get-scomalertwithlatencyinformation
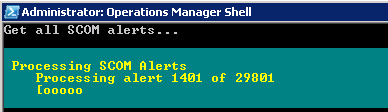
You will now have all enriched Alerts with latency greater than x minutes stored in the variable $result.
Step 3: Analyze the data
After gathering the data you have multiple choices to further analyze it with tools:
- Excel pivot table
You can use Excel pivot tables to analyze the data. Simply export the data to CSV and import it to Excel ($result | export-csv C:\Temp\alerts.csv). - PowerShell
You can analyze the data straight in PowerShell.
See the next examples:
What is the most common time difference?
PS C:\> $result | group AbsTimeDiffInMin -NoElement | sort count -Descending | select -First 10 | ft count,@{Label="AbsTimeDiffInMin";Expression={$_.name}} -auto
Count AbsTimeDiffInMin
----- ----------------
107 3
103 2
20 53
…
To identify the Agents causing most Alerts:
PS C:\> $result | group path -NoElement | sort count -Descending | select -First 10 | ft -AutoSize
Count Name
----- ----
22 xxx1.aaa.com
12 xxx2.aaa.com
11 xxx3.aaa.com
…
Which Management Server causes most of the alerts?
PS C:\> $result | group PrimaryMS -NoElement | sort count -desc
Count Name
----- ----
178 ms1.company.com
68 ms2.company.com
50 ms3.company.com
47 ms4.company.com
2 ms5.company.com
1 ms6.company.com
1 ms7.company.com
I think you will get the idea.
Step 4: Checking the Agents
Now that we have identified the Agents which create the most Alerts and the timeframe during which the problems occur (remember: all timestamps are UTC), we can now check the Agents.
Have a look for:
Event ID 25017 in the Operations Manager log:
Pointing to a delay in the Event processingEvent ID 21006 in the Operations Manager log:
Pointing to problems with general SCOM connectivityTime leaps in the log:
Usually SCOM should write at least one 6022 Event every 15 minutes. If this is not the case, there might be an issue:

Any other issues in the System log during the time when the Alerts where raised: time changes (Event ID 1), VSS backups, service restarts etc.
Most common causes for Alert logging latency on the agent side
What I figured out so far, the most common causes for Alert logging latency on the agent side are:
- Connectivity issues to the Management Server (Event ID 21006)
- Time sync issues, especially on virtual machines (caused by the Hypervisor or by specific sync tools or scripts)
- Agent freezes for a long time during VSS snapshot backup, especially on virtual machines
If you cannot find the root cause for the Alert logging latency with these tipps it is wise to open a case with Microsoft CSS to further investigate the issue.