Working with Crashdumps - Debugger 101
How many times have you been in the lab or pilot phase of a project and had a call that some of your lovingly-built-WIM-imaged machines are bluescreening at random intervals? What did you do? Did you suggest that "we should just see if it goes away" and then went back to playing with Microsoft Deployment? Me too... Until recently when I decided that it was time that I learnt to do some basic crashdump analysis.
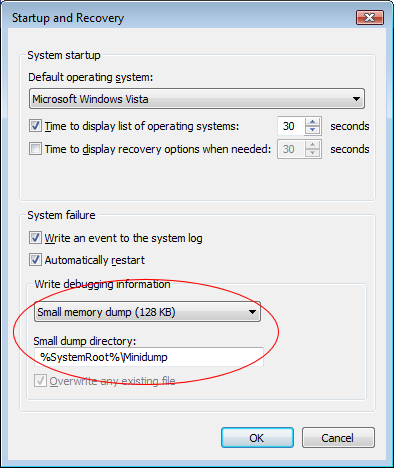
Often, if you actually catch a bluescreen in progress it can give you an idea of what went wrong - you may catch sight of a named DLL that you recognise. Unfortunately, most systems are configured to output a small memory dump (minidump) which is written so quickly that you may not even see the bluescreen at all before the system restarts. That's when we need know how to read a dump file.
Usually, on Windows XP and Windows Vista machines a bluescreen is caused by one of two things:
- Hardware fault
- Driver fault
That narrows it down a bit and analysing a crashdump can tell us what the operating system was doing - specifically the code it was executing - at the time of the crash. I've been told that if the analysis of a bluescreen points to a driver then that analysis is correct most of the time. I like those odds and it would certainly be an improvement from having no idea whatsoever and pondering if your Microsoft Support contract is up-to-date :)
At the end of the article I'll give some links to some great videos on the Sysinternals site that go through a lot of this stuff in depth, but I'll give you the basics to get started. Once you have your environment setup to look at crashdumps you can literally do a basic analysis in under a minute. What have you got to lose?
Setting up the Debugging Environment
First, we need to install some super elite hardcore debugging tools and set up a dynamic cache that points to an online Microsoft symbol server... No, I don't really know what it means either but I won't tell if you don't.
Seriously, we only have to do this once for the machine we want to do analysis on then we can forget about it. Promise.
First, download and install the x86 version of the Windows debugging tools from https://www.microsoft.com/whdc/devtools/debugging/installx86.mspx. Even if you are running an x64 operating system you can use the x86 debugging tools for this purpose.
Ok, now I mentioned symbols so what are they? Well, in the crashdump you can sometimes see the actual functions that were in progress at the time of a crash, these are shown as hexadecimal offsets into the DLL. I don't do hex so symbols simply convert these offsets into function names which can sometimes give a further clue to what is happening. The symbol files for the various different Microsoft operating systems can be downloaded from the main Windows Debugger Site - the problem is is that they are a few hundred megabytes per operating system. If you want to look at the odd crashdump then I'm sure you've got better things to do with your disk space. To get around this Microsoft has kindly put a publicly accessible server on the Internet that can be queried for symbols, and only the specific symbols you query are downloaded to your machine and cached. You can also use these symbols in other programs to help troubleshooting - more on that later.
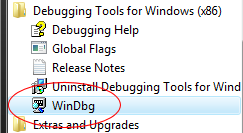
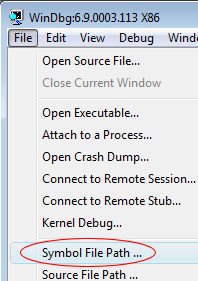
Open WinDbg from the Start Menu and the select the menu File \ Symbol File Path.
To use the online symbol server we need to first create a local cache folder. For this example create an empty folder at C:\Websymbols.
Note: If the folder doesn't exist then no symbols will be downloaded - make sure you create it now.
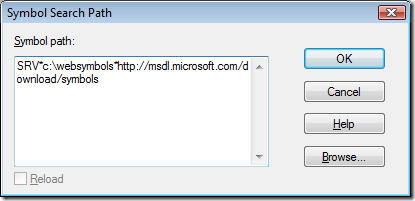
Now enter the symbol path as:
SRV*C:\Websymbols*https://msdl.microsoft.com/download/symbols
Click OK and then configure the Image File Path with the same SRV string (File \ Image File Path).
Now select File \ Save Workspace to save these settings for future sessions. Now whenever the debugger tries to resolve a symbol it will query the Microsoft server and cache the results in C:\Websymbols for future use.
That's it for setting up our environment - we're ready to go.
Analysing a Crashdump
Ok, so we have a .dmp file from a recent bluescreen (either a minidump or a full dump, I'll be using a minidump in the example). Open WinDbg and select the menu File \ Open Crash Dump.
First we get the initial output, after this stage there will be a pause.
Microsoft (R) Windows Debugger Version 6.9.0003.113 X86
Copyright (c) Microsoft Corporation. All rights reserved.Loading Dump File [C:\Users\jon\Desktop\TidyUp\Mini071808-01.dmp]
Mini Kernel Dump File: Only registers and stack trace are availableSymbol search path is: SRV*c:\websymbols*https://msdl.microsoft.com/download/symbols
Executable search path is:
Next, the symbol files will be downloaded and the initial "BugCheck" code will be shown. Again there will be a long pause at this point. You should notice that your C:\Websymbols folder is getting populated - if not, check your paths are correct.
Windows Server 2008 Kernel Version 6001 (Service Pack 1) MP (2 procs) Free x86 compatible
Product: WinNt, suite: TerminalServer SingleUserTS
Built by: 6001.18000.x86fre.longhorn_rtm.080118-1840
Kernel base = 0x81c00000 PsLoadedModuleList = 0x81d0d930
Debug session time: Thu Jul 17 22:32:39.910 2008 (GMT+1)
System Uptime: 0 days 14:10:38.979
Loading Kernel Symbols
...............................................................................................................................................................
Loading User Symbols
Loading unloaded module list
.............
*******************************************************************************
* *
* Bugcheck Analysis *
* *
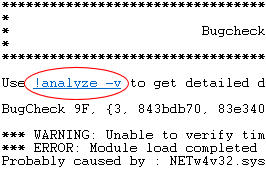
*******************************************************************************Use !analyze -v to get detailed debugging information.
BugCheck 9F, {3, 843bdb70, 83e34030, b19ded50}
Again, there will be a pause here as the crashdump undergoes basic analysis. Patience...
*** WARNING: Unable to verify timestamp for NETw4v32.sys
*** ERROR: Module load completed but symbols could not be loaded for NETw4v32.sys
Probably caused by : NETw4v32.sys
Notice the line "Probably caused by : NETw4v32.sys". Sounds interesting (and is probably the culprit) but let's do a full analysis by typing !analyze -v or by clicking the hyperlink shown.
Now we get this output:
*******************************************************************************
* *
* Bugcheck Analysis *
* *
*******************************************************************************DRIVER_POWER_STATE_FAILURE (9f)
A driver is causing an inconsistent power state.
Arguments:
Arg1: 00000003, A device object has been blocking an Irp for too long a time
Arg2: 843bdb70, Physical Device Object of the stack
Arg3: 83e34030, Functional Device Object of the stack
Arg4: b19ded50, The blocked IRPDebugging Details:
------------------DRVPOWERSTATE_SUBCODE: 3
IRP_ADDRESS: b19ded50
DEVICE_OBJECT: 83e34030
DRIVER_OBJECT: 83bbe708
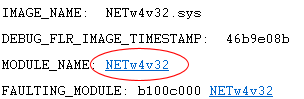
IMAGE_NAME: NETw4v32.sys
DEBUG_FLR_IMAGE_TIMESTAMP: 46b9e08b
MODULE_NAME: NETw4v32
FAULTING_MODULE: b100c000 NETw4v32
CUSTOMER_CRASH_COUNT: 1
DEFAULT_BUCKET_ID: VISTA_DRIVER_FAULT
BUGCHECK_STR: 0x9F
PROCESS_NAME: System
CURRENT_IRQL: 2
LAST_CONTROL_TRANSFER: from 81c2ac5f to 81cbb6d9
STACK_TEXT:
81cecacc 81c2ac5f 0000009f 00000003 843bdb70 nt!KeBugCheckEx+0x1e
81cecb28 81c2b29d 81cecb94 81d04cc0 81d04c00 nt!PopCheckIrpWatchdog+0x1ad
81cecb68 81c6b2a0 81d04ca0 00000000 a39067d0 nt!PopCheckForIdleness+0x343
81cecc88 81c6ae60 81ceccd0 00000002 81ceccd8 nt!KiTimerListExpire+0x367
81cecce8 81c6aa23 00000000 00000000 0031ec1b nt!KiTimerExpiration+0x22a
81cecd50 81c6954d 00000000 0000000e 00000000 nt!KiRetireDpcList+0xba
81cecd54 00000000 0000000e 00000000 00000000 nt!KiIdleLoop+0x49STACK_COMMAND: kb
FOLLOWUP_NAME: MachineOwner
FAILURE_BUCKET_ID: 0x9F_IMAGE_NETw4v32.sys
BUCKET_ID: 0x9F_IMAGE_NETw4v32.sys
It looks like something to do with the power state in this driver is causing a problem "DRIVER_POWER_STATE_FAILURE (9f)". In fact the problem does seem to happen often when sleeping/resuming so we might have a winner here. The "9f" part is called the BugCheck Code - if you want to get really dirty and dig deeper then you can find a list of BugCheck codes here.
To have a quick look at the details of the driver use the command lmvm MODULENAME. Is this case we would type lmvm NETw4v32 (or just click the module name hyperlink which is what I do :) ).
And the output:
Loaded symbol image file: NETw4v32.sys Image path: \SystemRoot\system32\DRIVERS\NETw4v32.sys Image name: NETw4v32.sys Timestamp: Wed Aug 08 16:26:03 2007 (46B9E08B) CheckSum: 00221C6E ImageSize: 00229000 Translations: 0000.04b0 0000.04e0 0409.04b0 0409.04e0
The interesting part here is the Timestamp, August 2007, that's quite an old driver. My first steps to troubleshoot this would be to identify the driver (looking at the file properties of NETw4v32.sys should give you what you need) and then downloading the latest version. If the problem still occurred with the latest driver then I would probably disable it completely to see if the problem stopped and then check if there are any other drivers that interact with this one. For example, this is a network driver so check if there are any custom VPN drivers installed that may be contributing to the problem. It's not much to go on but it's a start!
At home I was getting a bluescreen every day on my Vista x64 machine. After looking at the crashdump (my machine rebooted instantly and I never saw the bluescreen) it was always my video card driver. As an avid PC gamer I always had the latest driver (and often beta drivers...) but no matter which driver version I tried I would get the same problem. It turned out that the video card was overheating and that was causing it to crash (adding more fans cured the problem). It was still useful to know the general area of the problem though. Not a likely scenario in a corporate environment but something to bear in mind.
Of course, you could just download new drivers for everything and never bother with the crashdumps - but where's the fun in that? And this way you get to be a little smug... :)
Other Uses for Symbols
Most deployment guys will have the suite of Sysinternals tools at hand to troubleshoot weird deployment or performance problems. If you aren't using these tools then you need to download them right now, watch the technet webcasts and read Mark's Blog - nothing will ever be the same again :)
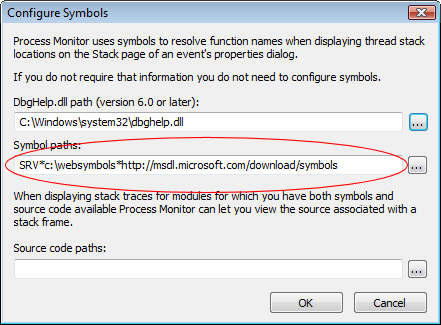
Many of the Sysinternals tools, such as Procmon and ProcExp allow you to look at stack traces and threads, all of which are shown as hex offsets. Happily we can reuse the symbol store that we set up earlier to allow the tools to give us a little more information. Have a look for options menus called "Configure Symbols..." and then set the server path and local cache as before:
Further Reading
The Windows Debugger Home Page - https://www.microsoft.com/whdc/devtools/debugging/debugstart.mspx
The Sysinternals Home Page - https://technet.microsoft.com/en-us/sysinternals/default.aspx
Sysinternals Webcasts - https://technet.microsoft.com/en-us/sysinternals/bb963887.aspx (In particular this one on debugging: TechEd On-Demand Webcast- Windows Hang and Crash Dump Analysis)
Mark Russinovich's Blog - https://blogs.technet.com/markrussinovich
I hope that's been of some use, if you have any suggestions or think we should do more/less of these geeky types of post then let me know at FirstName.SecondName@microsoft.com (real name is below) or post a comment.
This post was contributed by Jonathan Bennett a Senior Consultant with Microsoft Services, UK.