How to monitor your Windows Azure application with System Center 2012
Windows Azure is the PAAS (Platform As A Service) from Microsoft that literally allow any developer to start building its code an make it run on Internet in matter of minutes. This capability to host and run application in a short time has generated a lot of interest in the developer community.
An application deployed on Windows Azure immediately benefits from the power of the service and the capability to pay for the exact use of the platform. However, when the application goes into production, it should be monitored for the same purpose a traditional application shall be monitored : is my system running well ?
But there is at least one reason that is very specific to the cloud : am I paying the right price for my subscription ?
In this article we will see how System Center Operation Manager 2012 can help in this regards and how to implement it :
- Right sizing my Azure subscription
- How to configure Azure application to be monitored by System Center Operation Manager 2012 ?
- How to configure System Center Operation Manager 2012 to monitor my Azure Application ?
Right Sizing my Azure Subscription
Not like a traditional application, right sizing the Azure instances you will use is very important because it determined the price you will pay to host your application. For example, Windows Azure offers the following choices (as of May 1st 2012) :
- Extra Small (768 MB of memory, Shared CPU, 19 480 MB of storage for Web Roles and 5 Mbps allocated Bandwidth) : 10,64 €/month
- Small
- Medium
- Large
- Extra Large : (14 GB of memory, 8 Cores, 2 087 960 MB of storage for Web Roles and 800 Mbps allocated Bandwidth) : 510,63 €/month
Also keep in mind that in order to be supported regarding the SLA of Windows Azure, you need at least two instances.
You can read all the details about Azure pricing on this page : https://www.windowsazure.com/en-us/pricing/details/ (you can also access the Azure Pricing Calculator that allows you to calculate the exact pricing of your application based on your predicted usage)
As you can see, the sizing of your instances running your application has an impact not only on what the application can deliver but also the associated price. Azure is all about elasticity, therefore, you may want to evolve from an extra small instance to a medium or an extra large depending on the success of the application and the number of users using it. Maybe also several instances of your application to be resilient to upgrades or failures.
So the question is how do you ensure you have deployed the right size instance and the right number of them ? The answer is through monitoring. Let’ see how you can implement monitoring.
Configuring an Azure application to be monitored by SCOM 2012
System Center 2012 brings a series of components that allow the operation an monitoring of cloud applications (or a service as it should be called in the cloud computing words).
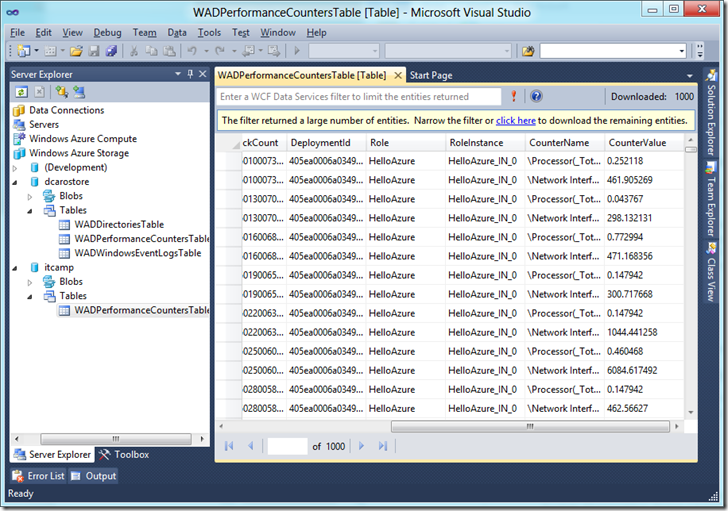
When you deploy an application to Azure, by default, monitoring is not enabled, it has to be enabled either in the code of the application itself or by whoever manages the Azure subscription (usually the IT Pro or the IT department). Implementing monitoring actually means that we will launch a diagnostic monitor instance and that instance will collect the data and at the interval you want. The collected data will be copied to an Azure Table :
- WADPerformanceCountersTable for the performance counters
- WADWindowsEventLogsTable for the windows event logs.
You can look at those tables in Visual Studio with the Azure SDK (you can download here : https://www.windowsazure.com/en-us/develop/downloads/ ).
Let see how monitoring can be implemented.
Enable performance monitoring with code
This option requires some code to be implemented. If, like me you are not an experimented developer and are just trying with a sample ASP.Net application, you can add the following code in the webrole.cs source file (in Visual Studio, start a new “Cloud” project in C# and paste the following code :
public override bool OnStart()
{
 // Create the instance of the diagnostic monitor
System.Diagnostics.Trace.Listeners.Add(new Microsoft.WindowsAzure.Diagnostics.DiagnosticMonitorTraceListener());

var dmconfig = DiagnosticMonitor.GetDefaultInitialConfiguration();
var cloudStorageAccount =
    CloudStorageAccount.Parse(RoleEnvironment.GetConfigurationSettingValue("Microsoft.WindowsAzure.Plugins.Diagnostics.ConnectionString"));

// Specify how often you want the perfcounters to be replicated, in this case it is every
dmconfig.PerformanceCounters.ScheduledTransferPeriod = TimeSpan.FromMinutes(15.0);

TimeSpan perfSampleRate = TimeSpan.FromSeconds(30.0);
// Add perf counters
dmconfig.PerformanceCounters.DataSources.Add(
    new PerformanceCounterConfiguration()
    {
        CounterSpecifier = @"\Processor(_Total)\% Processor Time",
        SampleRate = perfSampleRate
    });
dmconfig.PerformanceCounters.DataSources.Add(
    new PerformanceCounterConfiguration()
    {
        CounterSpecifier = @"\Network Interface(*)\Bytes Received/sec",
        SampleRate = perfSampleRate
    });

// We now need to start the instance of diagnostic monitor
DiagnosticMonitor.Start(cloudStorageAccount, dmconfig);
}
This code will start logging the %Processor Time and the Bytes Received/sec performance counters in the WADPerformanceCountersTable table. Look at the table in Visual Studio to see if the counter values appear. It may take some time, be patient !
Enable performance monitoring without code
The above method may not be always implemented. Sometime for the cost associated with it or simply because it was not in the initial design of the application. So in this case, you can activate application monitoring without having to change the code of the application. This is very useful in the case, for example, you simply want to perform specific analysis over a specific period of time.
In that case, you need to use some tools. I’m using two of them:
- Powershell cmdlets for Windows Azure that can be freely downloaded here : https://wappowershell.codeplex.com/
- Azure Diagnostics Manager 2 from Cerebrata. You can download an evaluation version from there website : https://www.cerebrata.com/
Once you have installed either one of the two tools, you can start activating the diagnostics for your Azure application.
Do it yourself mode
With powershell you need to run few cmdlets in order to activate the diagnostic monitor. I recommend reading the following article about this : https://www.davidaiken.com/2011/10/18/how-to-easily-enable-windows-azure-diagnostics-remotely/
If you simply want to enable CPU monitoring for example, you can follow those steps :
Create a storage account and deploy a webrole instance
Ensure you have a management certificate in place
Install the powershell cmdlets for Windows Azure
Run powershell and import the WAPPSCmdlets module
Specify the following variable for your environment :
$storageAccountName = "name_of_storage" (to replace with your storage account name) $storageAccountKey = "xxxxxxxxxxxxxxxxxxxxx" $deploymentSlot = "Production" $serviceName = "name_of_service" (to replace with your service name) $subscriptionId = "xxxxxxxx-xxxx-xxxx-xxxx-xxxxxxxxxxxx"Tip: if you don’t know you service name, it is what you see in your management console under “DNS Prefix”. In my case, it is dcaro.
Get the management certificate of your subscription :
$mgmtCert = Get-Item cert:\CurrentUser\My\5A58EEF405332E5AE40894D4666B067F60D44217You can verify if you have all setup correctly by running the following cmdlet:
Get-HostedService -SubscriptionId $subscriptionId -Certificate $mgmtCert -ServiceName name_of_serviceBefore continuing, you need the deployment ID that you’ll put in a variable :
 $did = (Get-Deployment -ServiceName dcaro -Certificate $mgmtCert -SubscriptionId $subscriptionId
-Slot Production).DeploymentId
You also need the roles list of your deployment :
 $roles = (Get-Deployment -ServiceName dcaro -Certificate $mgmtCert -SubscriptionId $subscriptionId
-Slot Production).RoleInstanceList
Now you can start setting up the performance counters you want to monitor for your deployment :
First, create a variable that will sample the %Processor Time every minute. You have to change it according to the counter you want to monitor :
 $cpuperfcounter = new-object Microsoft.WindowsAzure.Diagnostics.PerformanceCounterConfiguration
$cpuperfcounter.CounterSpecifier = "\Processor(_Total)\% Processor Time"
$cpuperfcounter.SampleRate = new-object TimeSpan(0,1,0)
Then, you set the monitoring of the counter
 $roles | foreach {Set-PerformanceCounter -PerformanceCounters $web_perf_counters -RoleName $_.RoleName
-InstanceId $_.InstanceName -BufferQuotaInMB 10 -TransferPeriod 15
-StorageAccountName $StorageAccountName -StorageAccountKey $StorageAccountKey -DeploymentId $did }
You can check if the configuration is correct :
 $roles | foreach {(Get-DiagnosticConfiguration -DeploymentId $did -StorageAccountName $storageAccountName
-StorageAccountKey $storageAccountKey -RoleName $_.RoleName
-InstanceId $_.InstanceName -BufferName PerformanceCounters).datasources } | fl

The above has been wrapped for readability but is is actually one line.
In my environment, I get the like :
SampleRate : 00:01:00
CounterSpecifier : \Processor(*)\% Processor Time
Of course, depending on your setting made in step 10.
This procedure can of course be scripted or you can use a partner solution.
Using an already packaged solution
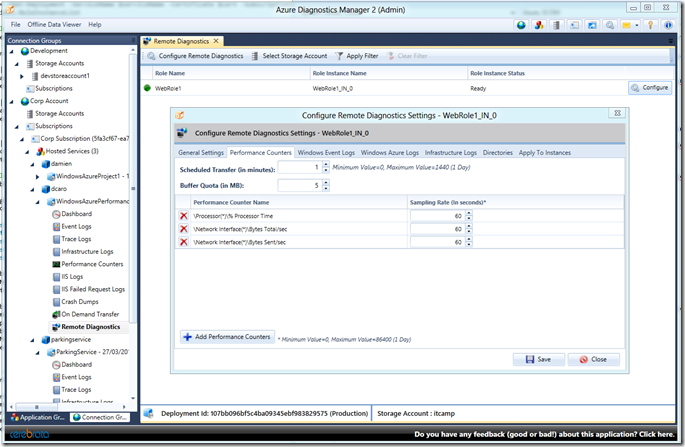
 As I’ve indicated above, we have a partner that has developed a solution that does the scripting for you automatically and makes the configuration
of the performance counters in Azure  as simple as using perform. Bellow a screenshot of the configuration of my Azure deployment.
Summary
We have configured one instance of Windows Azure to collect some performance counters without modifying the application code. The performance data will be collected by the Azure Diagnostic Monitor and moved at the interval you’ve specified to a table called WADPerformanceCounters. You can access this table in Visual Studio or with the Azure Diagnostic Manager or any tools you have that can read and Azure Table.
Once you have done the configuration, be patient and monitor the diagnostic table. If nothing appear in the table after twice the interval you have indicated, you can start wondering what is wrong in your configuration. Start with something simple before going with a large number of counters. The troubleshooting of the configuration will be easier.
Next Step
We have finished configuring Azure to enable the monitoring of the application. The next step is to configure SCOM to connect to Azure, collect the data that are present in the table and show them in a dashboard.
We will walk through those steps in this article (will be live tomorrow): https://blogs.technet.com/b/dcaro/archive/2012/05/03/how-to-monitor-your-windows-azure-application-with-system-center-2012-part-2.aspx


