Another case of unexplained server hang – ETW to the rescue
I received a call today from one of my customers who was experiencing intermittent server hangs and time drift up to five minutes on a mission critical application server. No intervention by the customer was required to bring system back in service, it sorted it out on its own. In the back of my mind, I had already jumped to conclusions about root cause related to Windows 2003 X86 kernel memory pressure exacerbated by deployment of legacy software on modern hardware. I am sure we all have worked those cases and have been able to identify similar problems quickly using tools like poolmon. As a matter of fact, I blogged about a case like that in the past here.
I was wrong. The problem was occurring on Windows 2008 R2 SP1 where previous limitations in kernel memory no longer are relevant since architecture has changed from X86 to X64. Additional information provided by was project used virtual machine deployment on 3rd party hypervisor only, no dedicated hardware had been deployed. Also, the virtual machine of primary concern was running alongside other virtual machines not related to project, it’s a shared environment and owners of other machines had never reported a problem to date. In many ways I prefer virtual environment because it streamlines number of kernel mode drivers which are typically installed versus hardware scenario.
The hangs and time drift symptoms were happening multiple times a day so we started by collecting baseline performance data using performance monitor. In reviewing the performance data collect during hang timeframe, system did not show any clues such as slow disk I/O or high CPU. However, there was approximately a five minute time window, matching time window as described by customer, where all data points were dropped, simply a gap in time. In Windows 2003 timeframe, there was no native instrumentation for this scenario. Typically we would ask for customer to generate a manual kernel crash dump and provide for review. This is tougher than it sounds from customer logistics standpoint. This would mean around the clock monitoring, adding registry keys to facilitate crash and interruption of business while machine writes contents of RAM to pagefile. It’s important to note, a kernel dump is a representation of a single point of time not a recorder from which we could watch how the system performs over a small period of time.
Enter Windows Performance Recorder which ships with Windows Assessment and Deployment Kit (ADK) for Windows® 8. This toolset leverages ETW which is defined as “general-purpose, high-speed tracing facility provided by the operating system. Using a buffering and logging mechanism implemented in the kernel, ETW provides a tracing mechanism for events raised by both user-mode applications and kernel-mode device drivers.” Where performance monitor collects one sample per second, Xperf will collect thousands per second, therefore large datasets will be collected. Full explanation of ETW and its implementation can be found here. The WPRUI.exe tools makes collecting a trace easy but in this scenario we need a method to collect at least 30 minutes of data needed a circular buffer. This command accomplishes those requirements.
[Xperf start command from elevated command prompt]
Xperf -on Latency+DISPATCHER -stackWalk CSwitch+ReadyThread+ThreadCreate+Profile -BufferSize 1024 -MaxBuffers 1024 -MaxFile 4096 -FileMode Circular
Xperf stop command:
Xperf -d SLOWHANG.etl
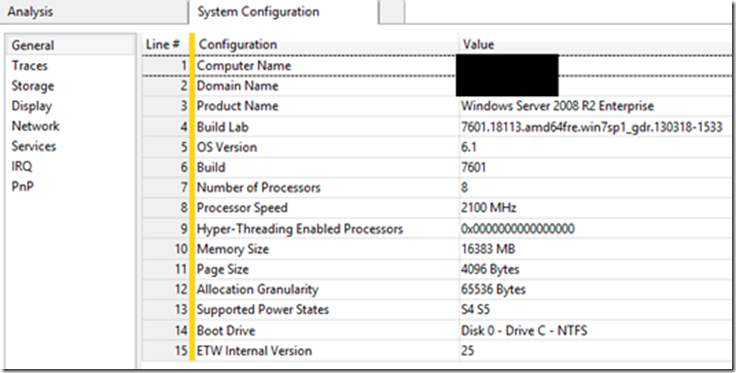
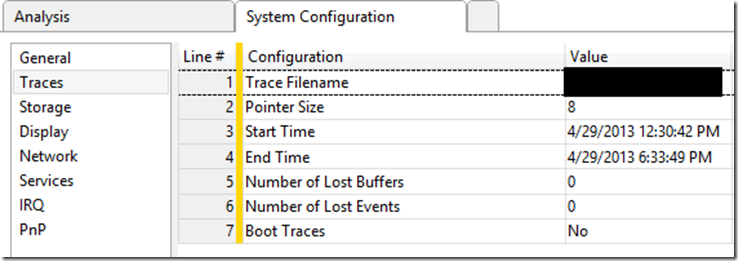
Armed with this information, my customer was able to collect traces and made them available for review. Since the window of time for this investigation is quite small, I found it helpful to document the server from which the trace was collected and time trace was collected which is in UTC. In WPA, if you click on “Trace” from the toolbar and then “System Configuration”, we get basic information about system.
The “Traces” item will provide time in UTC.
As a side note, you can run the following command to convert UTC to your time zone.
xperf.exe -i D:\SLOWHANG.etl -a tracestats
Opening the trace, looking at “Generic Events, Activity by Provider, Task,Opcode” you can see time period of exactly 300 seconds where nothing is reported. (5 minute period can be determines by simply left clicking on the for and dragging cursor to right for the period where data points are missing)
Looking at some of the other charts such as “CPU usage” we can clearly see a big drop is activity. In talking with one of our Escalation Engineers, Trey Nash from Global Escalation Services, he made a great point which ultimately led to a break in the case. Can we verify Windows is receiving clock interrupts from the HAL? Let’s take a moment to define what he means referencing Windows Internals book fifth edition.
“The length of the clock interval varies according to the hardware platform. The frequency of the clock interrupts is up to the HAL, not the kernel. For example, the clock interval for most x86 uniprocessors is about 10 milliseconds, and for most x86 and x64 multiprocessors it is about 15 milliseconds. This clock interval is stored in the kernel variable KeMaximumIncrement as hundreds of nanoseconds.” If the clock interrupt is not firing, it will negatively affect the dispatcher code and how it decides when a thread has exceeded its allotted time on the processor, known as quantum accounting. Additionally, essential mechanisms such as system timers will freeze and will not fire on time, or at all during the drop-out window, thus leading to apparent hang situations since many mechanisms within the OS rely on timers.
So let’s verify clock interrupts for the entire period and baseline number of them received for 1 minute period when things are “working”.
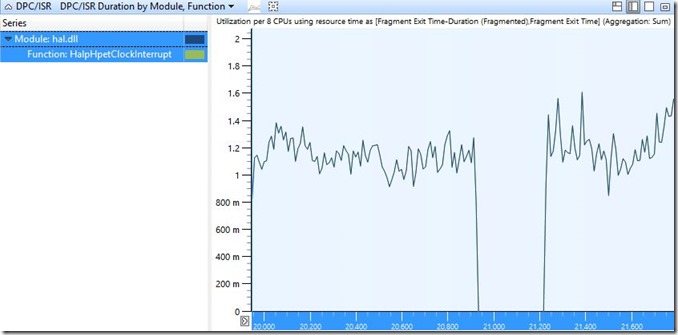
[Using DPC/ISR DPC/ISR Duration by Module, Function we can use handy “filter to selection” to focus on clock interrupts]
(Function under hal.dll is HalpHpetClockInterrupt)
Wow, we can see clearly that during the reported problem timeframe a gap of exactly 300 seconds no clock interrupts were received. How many should we expect to see during 1 second? After zooming into working period of roughly one second, you can locate the count by clicking on the “display graph and table” item on top right.
So for roughly one second we receive about ~1,500 clock interrupts.
So we should expect 450,000 or so for 300 seconds. How many did we receive during problem time period? Zero.
So not receiving clock interrupts from HAL is our root cause. If this was on hardware, this could potentially be bad processor etc. Since this is on hypervisor, we need to understand why that is happening. In this case, 3rd party vendor worked around issue by disabling HPET on a per VM basis and is working to develop a patch to address issue. In troubleshooting this case, we were able to collect many traces, in every instance where hang occurred, no interrupts were received during problem timeframe. As it turns out, the customer was experiencing this issue on multiple VM’s but were not aware of it because they were only tightly monitoring this one VM which was running critical workload.
I found this problem scenario and case to really highlight power and usefulness of ETW tracing. These tools and methods made a big difference in identifying root cause and stabilizing customer environment and perhaps will help you in your troubleshooting efforts.
Technorati Tags: Xen hypervisor,VMware,Hyper-VMware,Oracle VM VirtualBox,Windows 2008 R2,hang,time drift,HPET,clock interrupts,WPR,Windows Performance Recorder,Windows Performance Analyzer,dump


