The Case of the Unexplained High CPU Condition
Usually I start these posts with "One of my customers..." but in this instance this happened to me while supporting a internal line of business application. The platform is Windows Server 2008 Enterprise R2 running workloads IIS, (SCVMM) System Center Virtual Machine Manager 2008 R2, SQL 2008 SP1 on a server with 12 CPU's and 64 GB of RAM. This configuration had been in service for about two years without issue until a recent upgrade of our line of business application. Since that upgrade, the server with each day would exhibit increasingly high CPU culminating in all 12 CPUs being 100% utilized causing slow performance and client timeouts.
First steps were of course data collection. Our performance team recommends creating two standard data collector sets, the commands are below:
Setup a Performance monitor:
1. Open a command prompt and run the following command to create and start a Performance monitor log:
Logman.exe create counter Perf-Counter-Log15sec -o "c:\perflogs\Perflog15sec.blg" -f bincirc -v mmddhhmm -max 300 -c "\LogicalDisk(*)\*" "\Memory\*" "\Netlogon(*)\*" "\Network Interface(*)\*" "\Paging File(*)\*" "\PhysicalDisk(*)\*" "\Processor(*)\*" "\Process(*)\*" "\Redirector\*" "\Server\*" "\Server Work Queues(*)\*" "\System\*" "\Thread(*)\*" -si 00:00:15
Logman.exe create counter Perf-Counter-Log15min -o "c:\perflogs\Perflog15min.blg" -f bincirc -v mmddhhmm -max 300 -c "\LogicalDisk(*)\*" "\Memory\*" "\Netlogon(*)\*" "\Network Interface(*)\*" "\Paging File(*)\*" "\PhysicalDisk(*)\*" "\Processor(*)\*" "\Process(*)\*" "\Redirector\*" "\Server\*" "\Server Work Queues(*)\*" "\System\*" "\Thread(*)\*" -si 00:15:00
Logman start Perf-Counter-Log15sec
Logman start Perf-Counter-Log15min
2. After an event, run the following to stop logging.
Logman stop Perf-Counter-Log15sec
Logman stop Perf-Counter-Log15min
These two commands will create data collectors which collect data every 15 sec and 15 min. This will help build baseline information such as how long the condition takes to present itself.
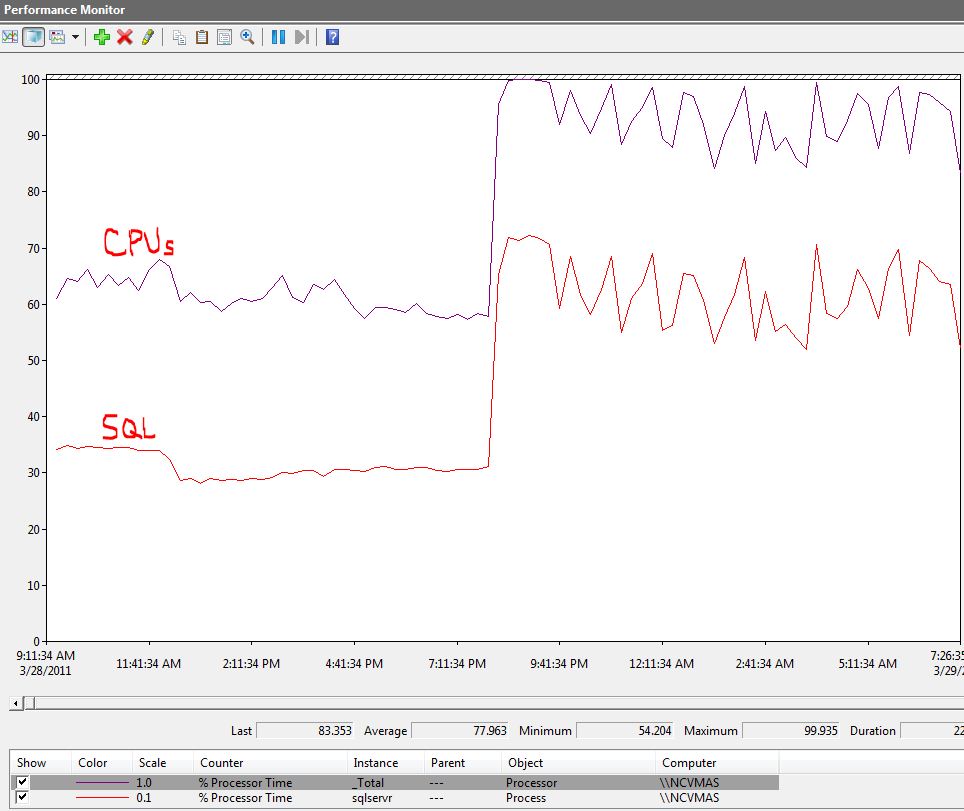
After the problem happened "perfmon" showed that, on average, all CPUs were utilized at roughly 60% where SQL accounted for 30%. However, when the problem occurred SQL CPU time doubled, causing a, high CPU condition.
So, now the question is, "What is causing this condition?" I turned to a great tool called xperf which can help diagnose a variety of issues in great detail. Xperf may require you to enable the following registry key, documented in the link below.
Reboot required supporting this:
https://technet.microsoft.com/en-us/library/cc959492.aspx
Description
“Specifies whether user-mode and kernel-mode drivers and kernel-mode system code can be paged to disk when not in use.”
Once you have your prerequisites in place, start Xperf by running the commands to isolate high CPU condition:
Trace Command(s)
xperf.exe –on Latency –stackWalk Profile
<repro, allow the High CPU condition to run for a couple of minutes.>
xperf -d HighCPU.etl
After you have collected the trace, while the high CPU condition was in state, open the file with xperf.
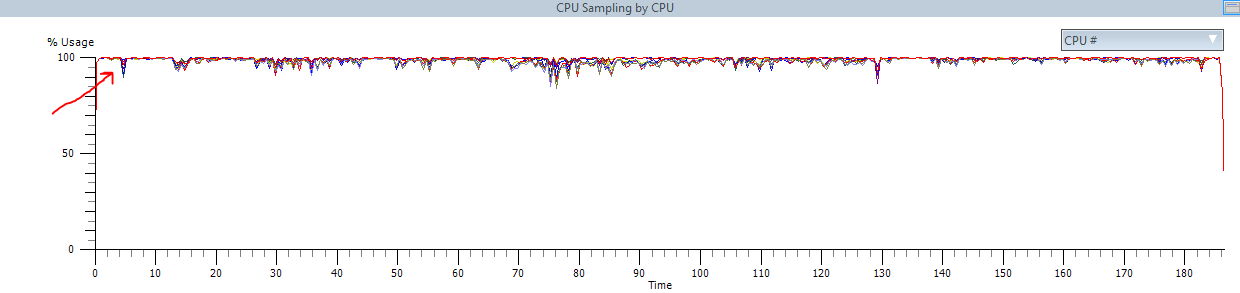
As we expected, similar to perfmon, CPU's are 100%. Next, we can filter based on processes.
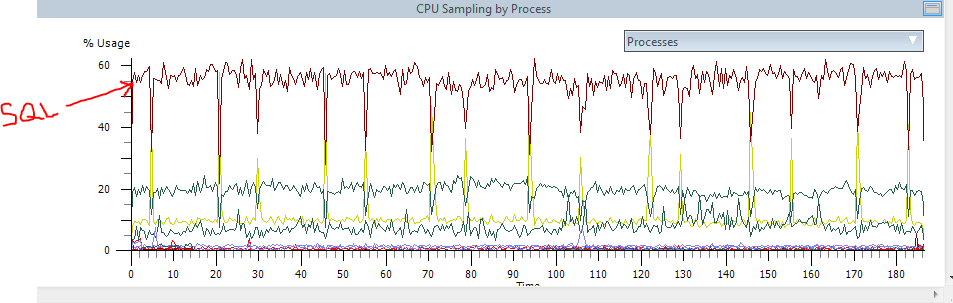
Again, confirming data similar to perfmon, SQL is having problems. So let's use Xperf to investigate some internals to see what is going on... You can click and select a segment of the graph and right-click summary table.
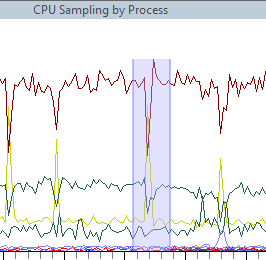
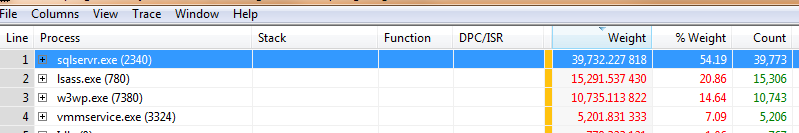
At this point, the weight column shows us our resource consumption. You can see the SQL Server is the busiest process with 54%. What is it doing? By expanding the collapsed cells around SQL you can view internal functions within SQL which will help us understand what SQL is doing.
I cannot share the actual trace results, as SQL functions are private. But, I can say that Xperf will show the entire stack down to the NIC level. What I noticed was SQL Server was stuck on a series of spinlocks. By definition, a spinlock is a lock where the thread simply waits in a loop ("spins"), repeatedly checking until the lock becomes available. As the thread remains active but isn't performing a useful task, the use of such a lock is a kind of busy waiting.
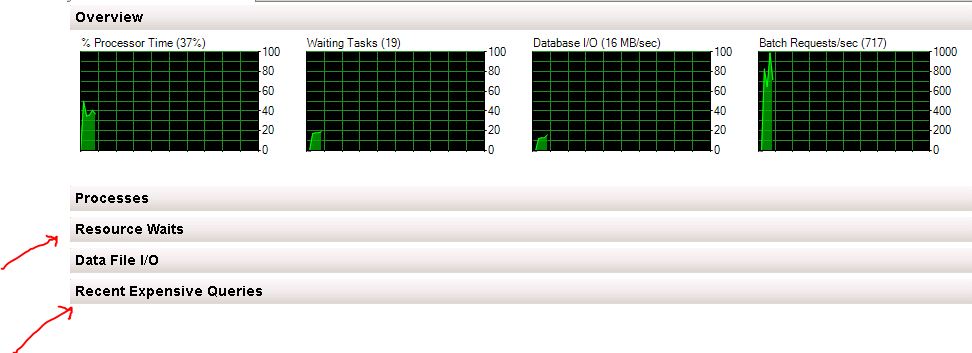
Why does SQL have a bunch of threads in a loop? Let's take a look at SQL more closely using tools out of box. I launched SQL Server Management Studio and clicked on "Activity Monitor". I can see immediately that the system has 19 waiting tasks, where it should be 0.
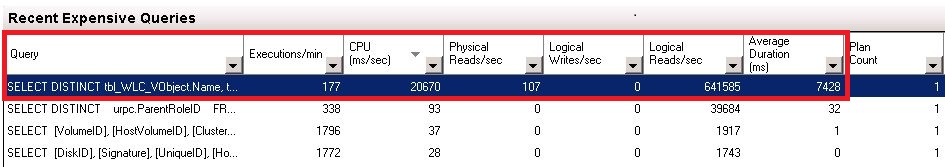
It's clear that the first item in the list is the culprit. For each time this procedure is called, it takes anywhere from five to seven and a half seconds to complete. Further, we are calling the procedure 177 times per minute. This is simply not sustainable. Over time as SQL cannot complete this task, jobs are placed in a queue via spinlocks which can never complete, thereby eating CPU over time.
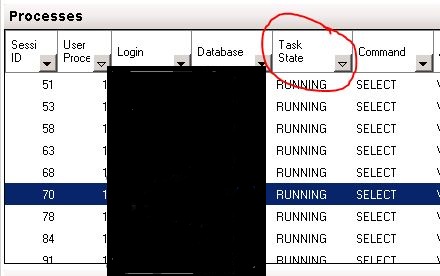
I expanded the Process tab and sorted by running tasks. Sure enough all of the tasks pending are the same stored procedure.
In my view there are two main questions:
1. Can we reduce the execution frequency of the stored procedure?
2. Can the prcocedure itself be optimized?
The procedure itself is design to collect information about running virtual machines in our farm. In our test envrionment, the number of running virtual machines is quite small. Our production environment has about 2,000 virtual machines so this is really a matter of scale and performance load. Regarding question number one, we reduced the frequency of the call to every ten seconds versus every two seconds, especially since based on our data above we know that the query itself can take between 5 and 8 seconds to complete. Therefore, we should never be calling the same query until the first one completes. On the second question, we leveraged the "Execution Plan" feature in SQL Server to provide advice on how to improve our query itself. Adding the index recommended below greatly improved the performance of query.
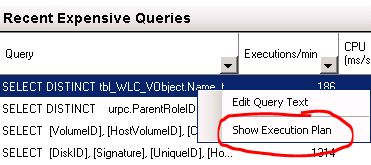
Suggestion solution from SQL Server Execution Plan:

Results from the performance tuning:
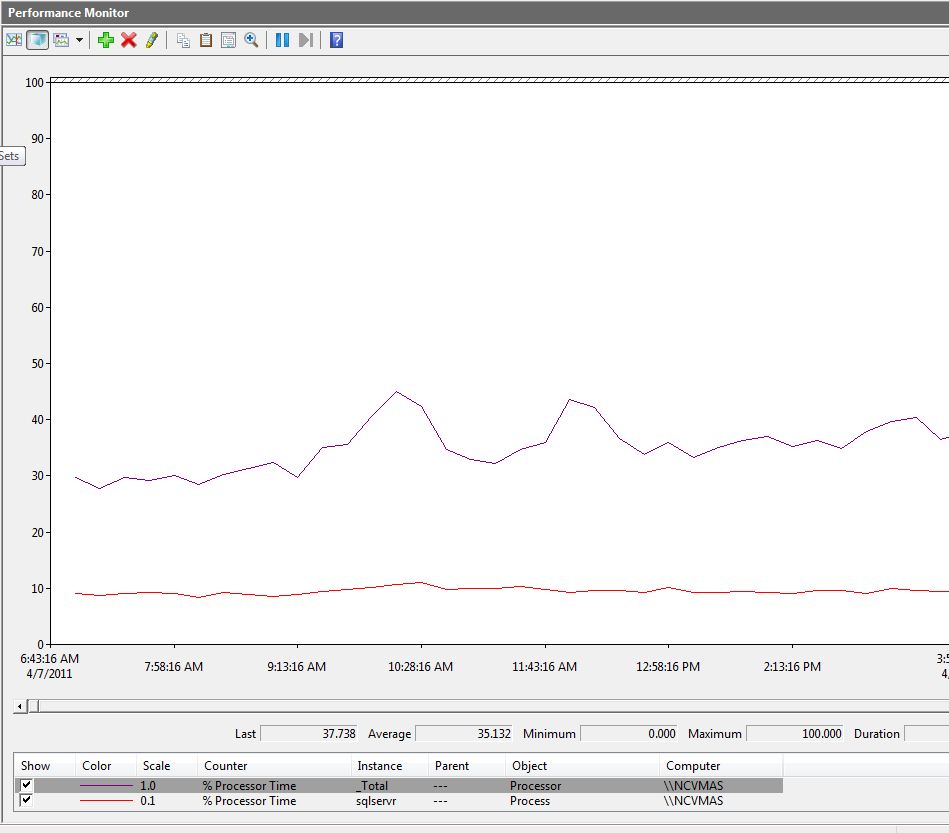
In summary, we reduced overall CPU utilization from 78% to 35% reducing it by more than half. Further, we leveraged some terrific tools such as Perfmon, XPerf and Activity monitor to determine root cause and implement solution. If you come across a similar situation, these tools and troubleshooting steps may be of some benefit.
Dave Guenthner [MSFT]
This posting is provided "AS IS" with no warranties, and confers no rights.