How to Consolidate Data Migration Assistant JSON Assessment Reports
Starting from Data Migration Assistant (DMA) v 2.1, DMA provides command-line support for running assessments in unattended mode. This feature helps to run the assessments at scale. The command-line version of DMA generates the assessment results in the form of a JSON or CSV file.
You can assess multiple databases in a single instantiation of DMA command line utility and export the all the assessments results into a single JSON file or assess one database at time and later consolidate the results from these multiple JSON files into a SQL database.
Check out the following link on how to run the DMA tool from command line: Data Migration Assistant: How to run from command line
Use the attached PowerShell script to import the assessment results from JSON files into a SQL Server database.
Using the PowerShell script:
You will need to provide the following information upon script execution:
- serverName: SQL Server instance name that you want to import the assessment results from JSON files.
- databaseName: The database name that the results gets imported to
- jsonDirectory: The folder that the assessment results saved in one or more JSON files.
- processTo: SQLServer
Supply the above parameter values in the PowerShell script in the "EXECUTE FUNCTIONS" section as it appears below.
dmaProcessor -serverName localhost `
-databaseName DMAReporting `
-jsonDirectory "C:\temp\DMACmd\output\" `
-processTo SQLServer
The PowerShell script creates the following objects in the SQL instance you have specified if they don’t already exist:
- Database – The name provided in the PowerShell parameters
- Main repository
- Table – ReportData
- Data for reporting
- Table - BreakingChangeWeighting
- Reference table for all breaking changes. Here you can define your own weighting values to influence a more accurate % upgrade success ranking
- View – UpgradeSuccessRanking_OnPrem
- View displaying a success factor for each database to be migrated on premise
- View – UpgradeSuccessRanking_Azure
- View displaying a success factor for each database to be migrated on premise
- Stored Procedure – JSONResults_Insert
- Used to import data from JSON file into SQL Server
- Stored Procedure – AzureFeatureParityResults_Insert
- Used to import Azure feature parity results from JSON file into SQL Server
- Table Type – JSONResults
- Used to hold the JSON results for on premise assessments and passed into the JSONResults_Insert stored procedure
- Table Type – AzureFeatureParityResults
- Used to hold the Azure feature parity results for azure assessments and passed into the AzureFeatureParityResults_Insert stored procedure
The PowerShell script will create a “Processed” directory inside the directory you provided which contains the JSON files that are to be processed.
Once the script completes, the results are imported into the table ReportData.
Viewing the Results in SQL Server
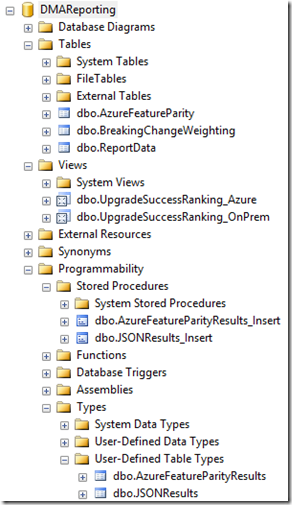
Once the data has been loaded, connect up to your SQL Server instance. You should see the following:
The dbo.ReportData table contains the contents of the JSON file in it’s raw form.
On Premise Upgrade Success Ranking
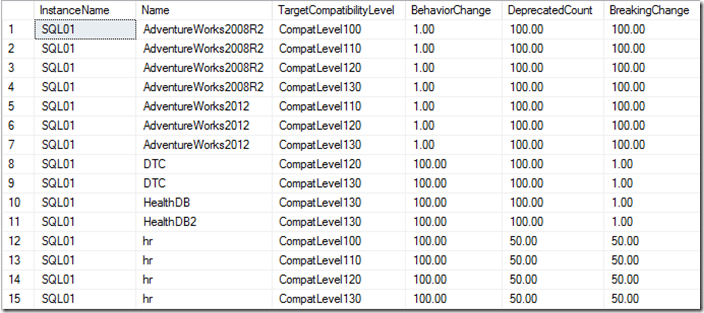
To see a list of databases and their % success rank, select from the dbo.UpgradeSuccessRanking_OnPrem view:
Here we can see for a given database what the upgrade success chance is split by greater compatibility levels. So for example, HR was assessed against compatibility level 100, 110, 120 and 130. This helps you visually see how much effort is involved in migrating to a greater version of SQL Server to the one the database is currently on.
Usually the metric we care about is how many breaking changes there are for a given database. In the above example we can see that the HR database has a 50% upgrade success factor.
This metrics can be influenced by altering the weighting values in the dbo.BreakingChangeWeighting table.
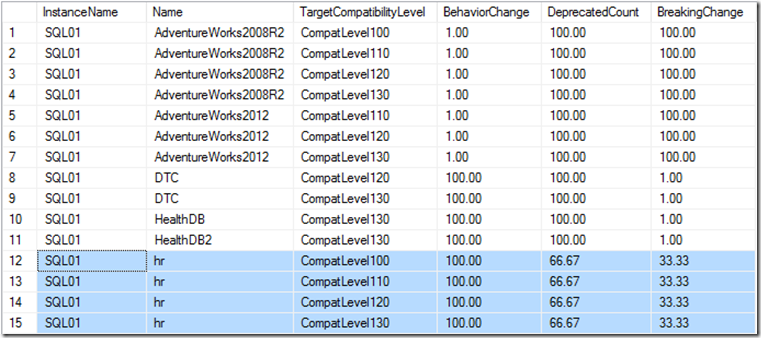
For example, I've decided that the effort involved in fixing the syntax issue in the HR database is quite high so I've assigned a value of 3, it wouldn’t take long to fix so I've assigned a value of 1 and there would be some cost involved in making the change so I've assigned a value of 2. This changes the blended Changerank to 2.
Note: The scoring is on a scale of 1-5. 1 being low 5 being high. Also note that ChangeRank is a computed column.
Now when I query the dbo.UpgradeSuccessRanking_OnPrem view my upgrade success factor for Breaking Changes now drops:
Azure Upgrade Success Ranking
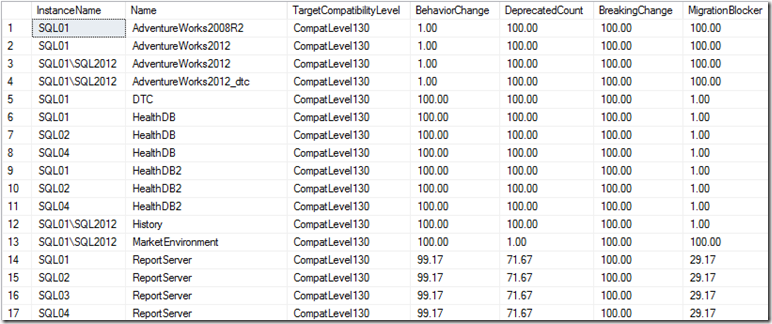
Similar to the on premise ranking, to see a list of databases to migrate to Azure SQL DB and their % success rank, select from the dbo.UpgradeSuccessRanking_Azure view:
Here we are interested in the MigrationBlocker value. 100.00 means that there is a 100% success rank for moving this database to Azure SQL Database V12.
The difference with this view is that there is currently no override for changing the weighting for migration blocker rules.
To review a method of reporting on this data set using PowerBi checkout this blog post.
Get the script here
Learn more
Report on your consolidated assessment reports using Power BI Data Migration Assistant Blog


