Query Store: How it works? How to use it?
Part 1
“The SQL Server Query Store feature provides you with insight on query plan choice and performance. It simplifies performance troubleshooting by helping you quickly find performance differences caused by query plan changes. “ msdn.
If you want to know, how to enable it, you can find information here: https://msdn.microsoft.com/en-US/library/dn817826.aspx
Once you enabled the Query Store for the database you can change some of the settings, for more information: Query Store - Settings and Limits
If you want to know more about the cleanup retention, you can find information here: Query Data Store Size Cleanup Retention
The focus of this post is to discuss how query store works internally and how to use it.
So, first things first, the query store execution flow, exemplified by figure 1:
1) SQL Server existing components interact with query store by utilizing Query Store Manager.
2) Query Store Manager determines which Store should be used and then passes execution to that store (Plan or Stats). Note: Query Store is enable per database, so that happens at database level.
3) Plan and Runtime Stats store uses Query Data Store as an extension to SQL Server.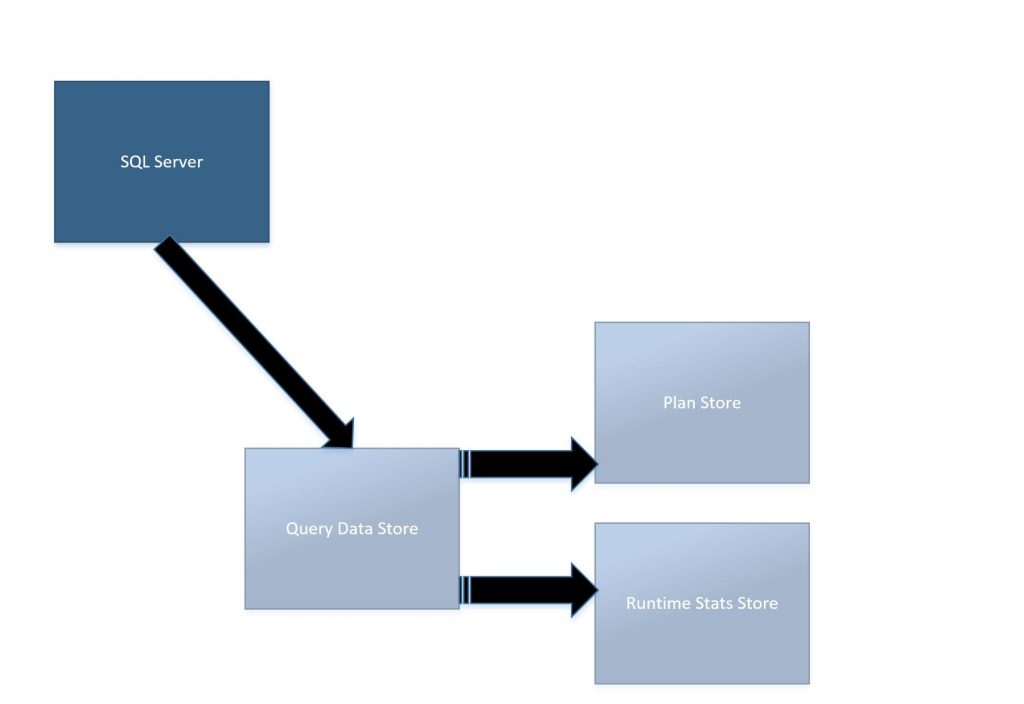
Figure 1: Query Store execution flow
You may be asking yourself right now what is plan store and runtime stats store. And if you are asking yourself this question, I have a good news. That is the next topic.
MSDN definition (https://msdn.microsoft.com/en-US/library/dn817826.aspx ) : The query store contains two stores; a plan store for persisting the execution plan information, and a runtime stats store for persisting the execution statistics information.
So….
Plan Store: it is accountable for capturing all information that is related to query compilation.
Runtime Stats Store: that one is probably the most frequently updated store. These statistics represent query execution data.
Each store has a set of DMVs that represents the idea of the store:
Plan store DMVs:
- Sys.query_store_query_text – Presents unique query texts executed against the database. (https://msdn.microsoft.com/en-us/library/dn818159.aspx )
- Sys.query_store_plan – Presents estimated plan for the query with the compile time statistics (https://msdn.microsoft.com/en-us/library/dn818155.aspx )
- sys.query_context_settings – Presents unique combinations of plan affecting settings under which queries are executed. (https://msdn.microsoft.com/en-us/library/dn818148.aspx )
- sys.query_store_query – Query entries that are tracked and forced separately in the Query Store.( https://msdn.microsoft.com/en-us/library/dn818156.aspx )
Run-time stats store DMVs:
- sys.query_store_runtime_stats_interval – Query Store divides time into automatically generated time windows (intervals) and stores aggregated statistics on that interval for every executed plan. (https://msdn.microsoft.com/en-us/library/dn818158.aspx )
- sys.query_store_runtime_stats – Aggregated runtime statistics for executed plans. (https://msdn.microsoft.com/en-us/library/dn818147.aspx )
Summarizing: Query data store will store the data of the right store per threshold previously set, figure 2 tries to demonstrate this. More details here: https://blogs.technet.microsoft.com/dataplatform/2016/10/25/query-store-settings-and-limits/ :
- The Plan Store is flushed every 15 minutes by default.
- The default collection interval for the runtime statistics is 60 minutes.
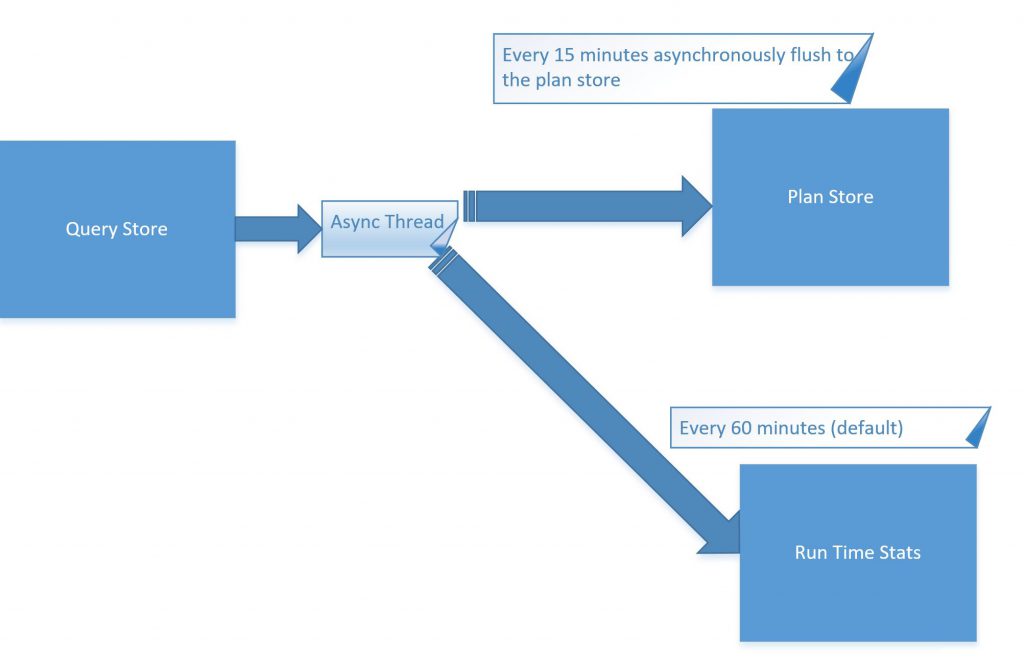
Figure 2: Query data store async
Note 1: Query Store is persisted to disk, so it survives a crash. But Query Store is also Async, it means if the data has not been persisted and a crash happens in the meantime, the data will be lost. Although, if SQL Server must be restart because of a maintenance routine you could force Query Store to be flush using the procedure: sp_query_store_flush_db
Note 2: If you want to copy the data from Query Store ( system query store tables) from a database to another. You must do it manually copying the data to the user tables ( you could use BCP for instance). It is not possible at this moment ( SQL Server 2016 SP1) to copy the Query Store system tables from one database to the Query Store system tables from another database.
Note 3: Query Store could generate a performance overhead of up to 1.5-2% for the most intensive workloads. Additionally, CPU, memory and IO consumed by Query Data Store are all resource governed, especially on SQL Azure DB, where the lower tier instances have more strict resource limits. The purpose of all these limits is to limit the Query Store impact on the rest of the user database.
Ok. But, how to use query store?
Using Query Store Reports:
After enabling the query store, refresh the database portion of the Object Explorer pane to add the Query Store section. You will be able to see some reports:
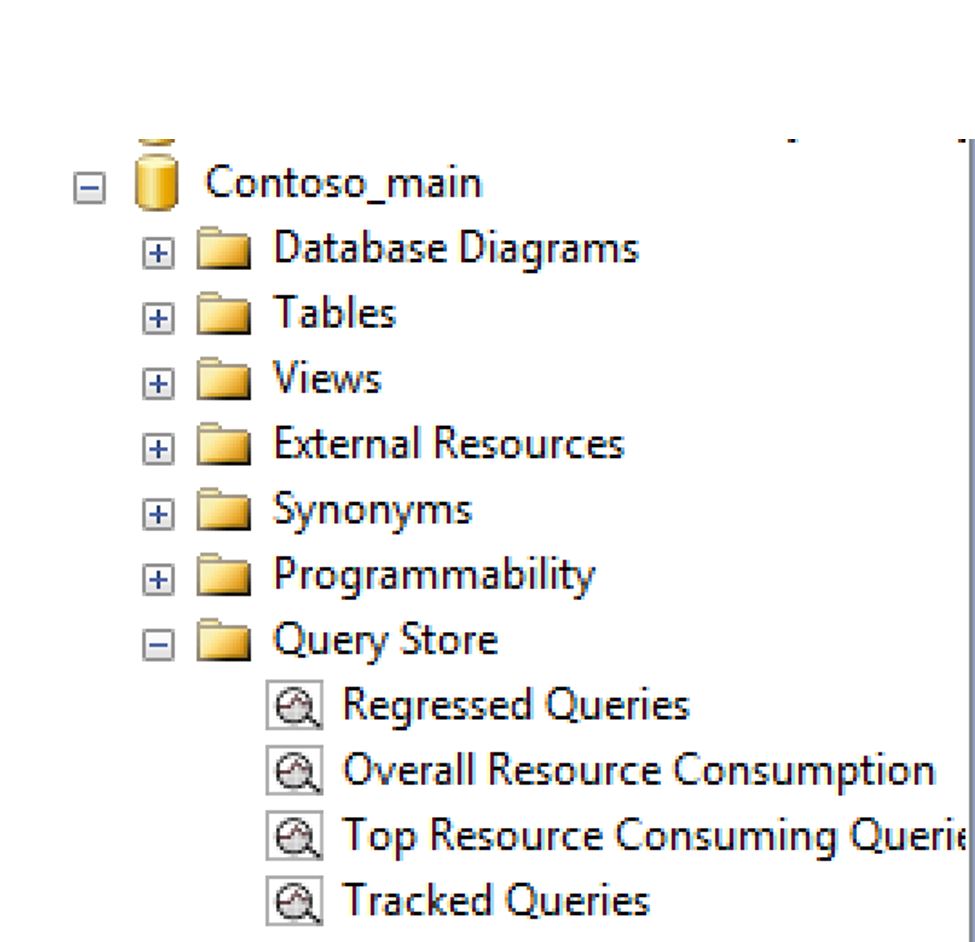
Figure 3: Query Store Reports
As it shows the figure 3 query store has four reports. More details here: https://msdn.microsoft.com/en-US/library/mt614796.aspx
Regressed Queries: is a report that can be used to identify all queries which execution metrics have been degraded in the period of time of interest (last hour, day, week, etc.).
Overall Resource Consumption: It shows the overall resource consumption during the last month in four charts: duration, execution count, CPU time, and logical reads
Tracked Queries: With this report is possible to monitor a specify query. Just filter using the query ID as demonstrate figure 4.
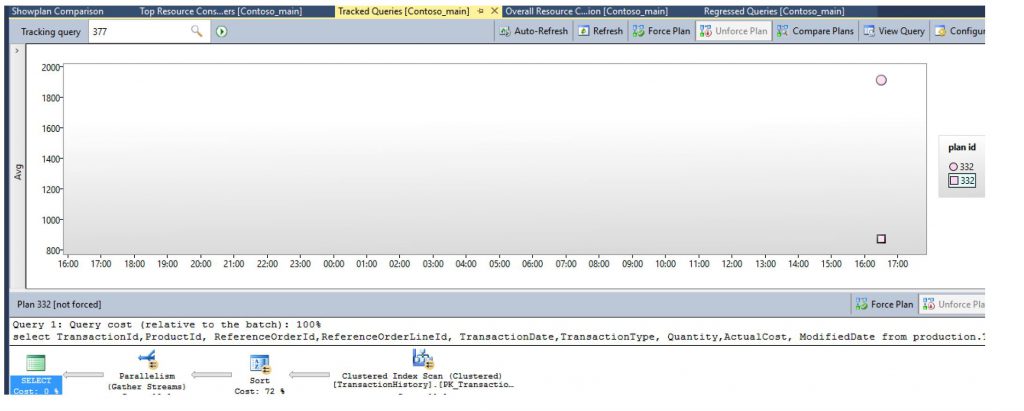
Figure 4: Tracked Queries
Top Resource Consuming Queries as the name says are the queries that are consuming most of the resources, like most of CPU or the queries that are taking more time to finish the execution (elapsed time), or still the ones that are consuming more memory, or top logical reads, writes and even physical reads, as it shows figure 5. Although your workload may generate thousands of queries, typically only a handful of them use most of the system resources and therefore require your attention.
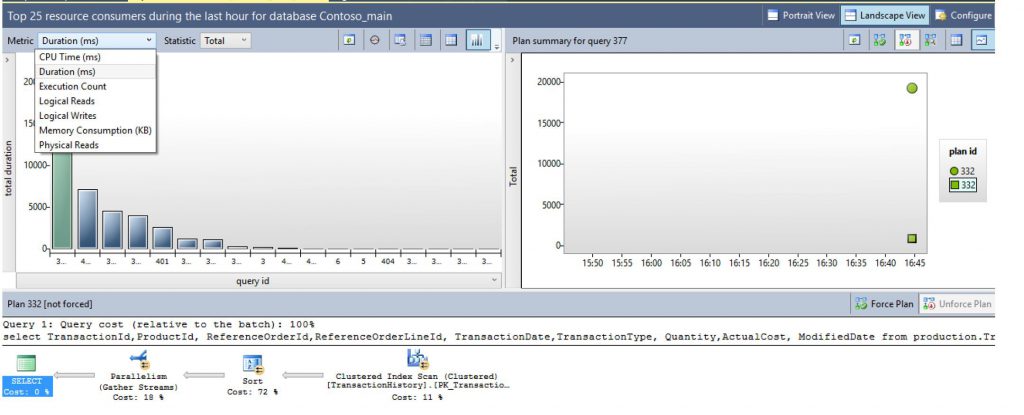
Figure 5: Top Resource Consuming Queries
Regards to the reports provided by Query Store. There are a few features inside of them, that you could use for troubleshooting.
1) It is possible to compare plans, especially useful in case of parameter sniffing.
Scenario: Suppose a situation when a procedure is compilated with a parameter that results in a few rows, after running this procedure a few times you realize that the data is skewed and the plan that was generated using that first parameter is not the best plan possible for other parameters. In this case, you choose to recompile your procedure once more with a different parameter, which results in a very different plan. At that point, you notice that you can have two different plans for the same procedure and you want to compare both.
Good news: Query store keeps the track for that kind of situation. As figure 6 and 07 shows.
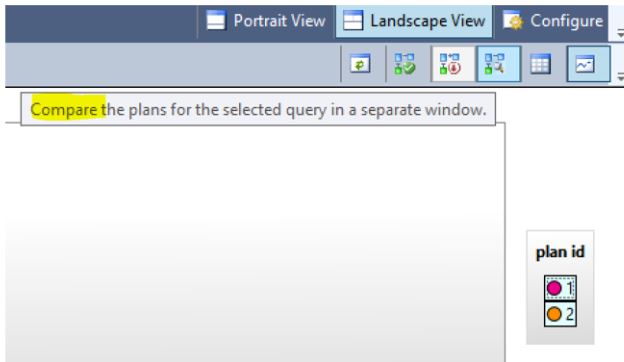
Figure 6: Compare plans feature
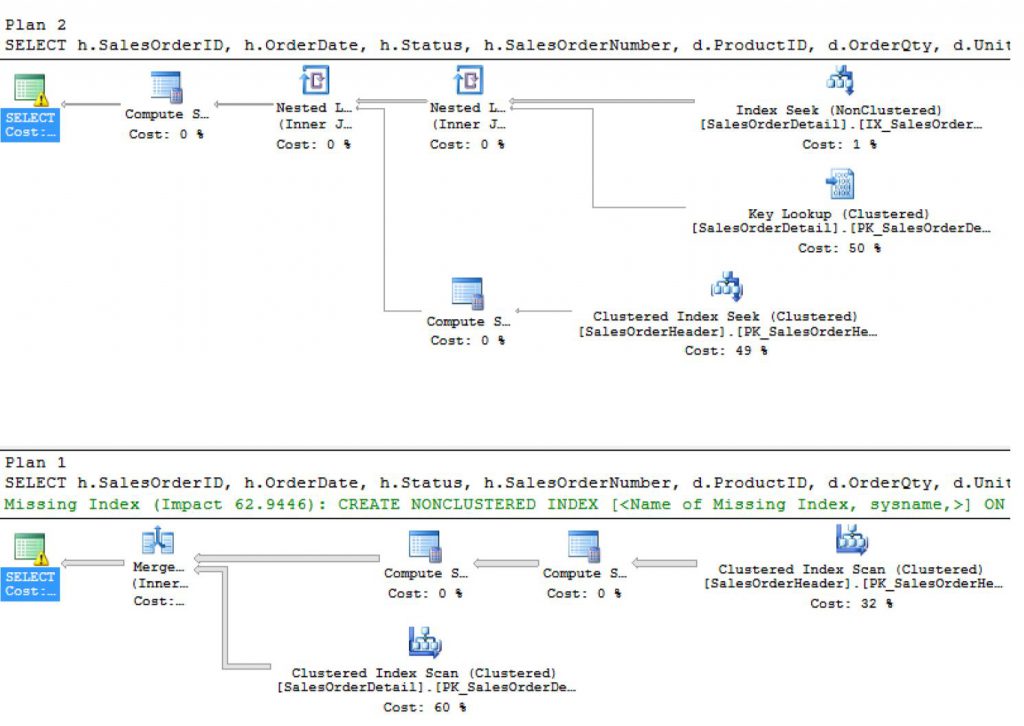
Figure 7: Compare plans
2) It is also possible to force the plan.
Scenario: You have two different plans for the same procedure. That procedure was recompiled twice with two different parameters that returned a very different result set, the data is skewed. You understand that probably one of the plans is better than the other in a way that you want to prevent, even in a case of recompilation that the plan that is not good enough to be used. Query store provides the option: force plan, as you may see at figure 8 .
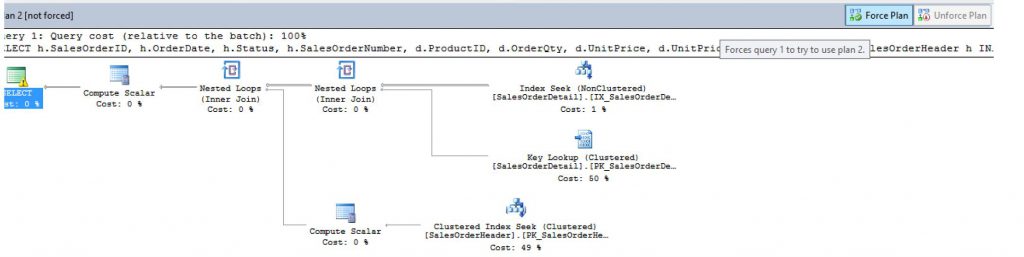
Figure 8: Force Plan.
That option is not only available at the Query Store report. It is also available using T-SQL:
o Force Plan:
[sql] sp_query_store_force_plan @query_id, @plan_id [/sql]
In terms of T-SQL you have other couple of interesting options:
o Stop plan forcing :
[sql] sp_query_store_unforce_plan [/sql]
Others T-SQL options:
o Removes a single plan from Query Store:
[sql] sp_query_store_remove_plan [/sql]
o Clear runtime stats for a specific query plan:
[sql] sp_query_store_reset_exec_stats [/sql]
o Gets the stmt_sql_handle for a Transact-SQL statement under given parameterization type (simple or forced):
[sql] sys.fn_stmt_sql_handle_from_sql_stmt [/sql]
Everything that you have in the report and even more information you can have using the Query Store DMVs and you could also correlate Query Store Information with SQL Server dynamic view and functions:
[sql]
SELECT qt.query_text_id
, q.query_id, qt.query_sql_text
, qt.statement_sql_handle
, qs.max_elpased_time
FROM sys.query_store_query_text qt
JOIN sys.query_store_query q
ON qt.query_text_id = q.query_id
CROSS APPLY sys.fn_stmt_sql_handle_from_sql_stmt (qt.query_sql_text, null) fn_hanlde_from_stmt
JOIN sys.dm_exec_query_stats qs
ON fn_hanlde_from_stmt.statement_sql_handle = qs.statement_sql_handle
[/sql]
And again as always, thanks Dejan Krakovic for answer a lot of my doubts regards to query store!
Next post let’s try to explore more the power of Query Store DMVs.
Liliam Leme
UK SQL PFE