Showing Baseline in OpsMgr Performance View
There are a few very good explanations on blogs discussing the difficult adjustments of STT (self-tuning-thresholds) monitors
like this <opsmgrunleashed.wordpress.com/2007/06/20/opsmgr-by-example-configuring-baselines/> or <blogs.technet.com/b/kevinholman/archive/2008/03/19/self-tuning-thresholds-love-and-hate.aspx>
When discussing advantages and disadvantages of self-tuning-threshold monitors in OpsMgr with customers I often be asked how we can really SEE a calculated baseline.
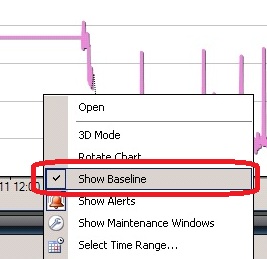
According to this technet page we can switch on the baseline on performance views by right mouse click and select "Show Baseline"
In most cases you can't see anything that's looking like a "baseline".
To really see the calculated baseline you need to ensure a few things:
- You need to switch on "Show Baseline" option on the performance view.
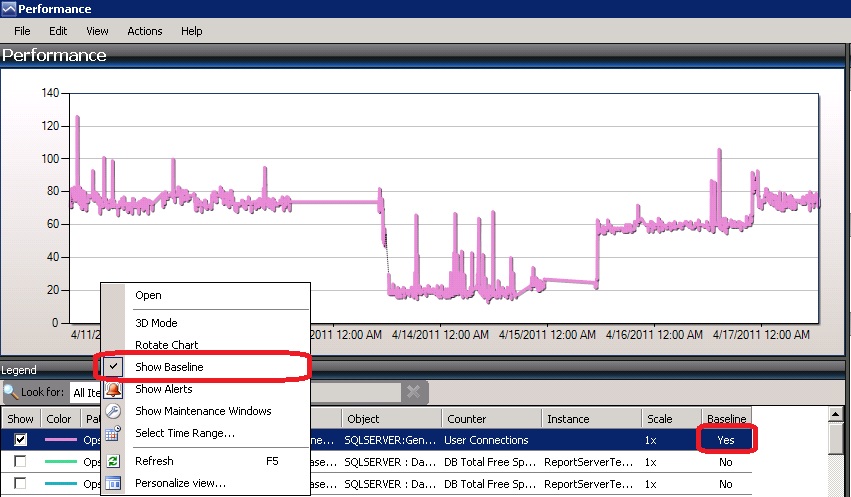
- You need to have selected a counter that really has got a calculated baseline (check column "Baseline") . This flag will switch to "YES" once the baseline calculation has finished (depends on the configured business cycle).
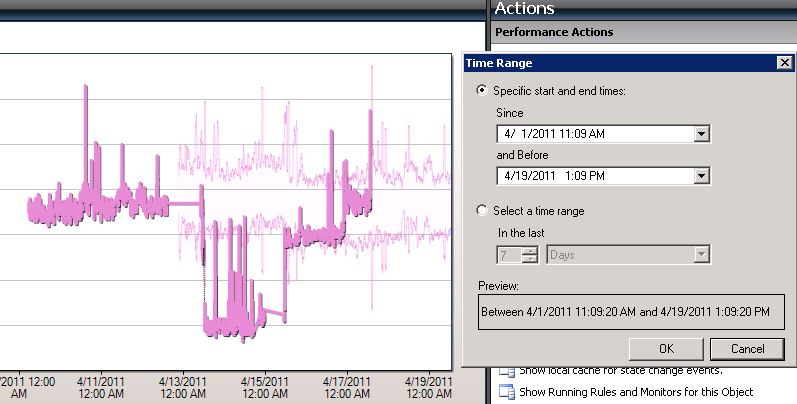
- Important: You need to show a time range beginning at least one complete business cycles backwards. (Attention: Weekly business cycle starts on Saturday 10PM (UTC). To be sure to see the baseline better take 2 weeks backwards)
I know that sounds silly because typically you store only 1 week performance data in your operational DB, but remember the baseline calculation started already one week before.
 (Today: 4/17/2011)
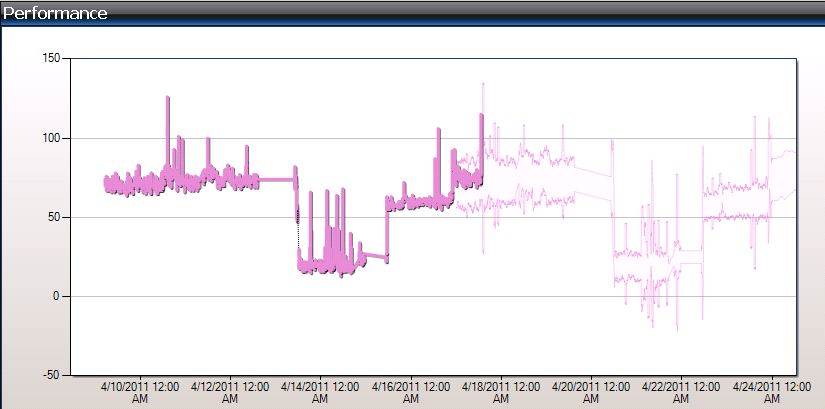
..... to see the actual running baseline calculation for the next week you can extend the time range to one business cycle (1 week) into the future.
I hope that helps understanding some strange alerts fired from baseline monitors. ;-)