A backup server flooded by DPCs
Hi,
I’ve just finished working on a case with a customer that was so interesting that it deserved a blog post to round it off.
These were the symptoms:
Often while logged in to the server things would appear to freeze – no screen updates, little mouse responsiveness, if you could start a program (perfmon, Task Manager, Notepad etc.) then you wouldn’t be able to type into it and if you did it would crash.
This Windows Server 2008 R2 server runs TSM backup software with thousands of servers on the network sending their backup jobs to it. At any one time there could be hundreds of backup jobs running. The load was lower during the day, but it was always working hard dealing with constant backups of database snapshots from servers. The backup clients are Windows, UNIX, Solaris, you name it…
When the server froze, you’d see 4 of the 24 logical CPUs lock at 100% and the other 20 CPUs would saw-tooth from locking at 100% to using 20-30%. The freeze would happen for minutes at a time.

There are 2 Intel 10GB NICs in a team using Intel's teaming software. The team and the switches are setup with LACP to enable inbound load balancing and failover.
By running perfmon remotely before the freeze happens we could see that the 4 CPUs that are locked at 100% are locked by DPCs. We used the counter “Processor Information\% DPC Time”.
A DPC is best defined in Windows Internals 6th Ed. (Book 1, Chapter 3):
| A DPC is a function that performs a system task—a task that is less time-critical than the current one. The functions are called deferred because they might not execute immediately. DPCs provide the operating system with the capability to generate an interrupt and execute a system function in kernel mode. The kernel uses DPCs to process timer expiration (and release threads waiting for the timers) and to reschedule the processor after a thread’s quantum expires. Device drivers use DPCs to process interrupts. |
Because this is a backup server, we’re expecting that the bulk of our hardware DPCs will be generated by incoming network packets and raised by the NICs. Though they could have been coming from the tape library or the storage arrays.
To look into what exactly is generating DPCs and how long the DPCs last for, we need to run Windows Performance Toolkit, specifically WPR.exe (Windows Performance Recorder). We have to do this carefully. We don’t want to increase the load of the server by capturing the Network and CPU activity of a server which already has high activity on the CPU and Network, and has shown a past history of crashing. But we want to run the capture while the server is in a frozen state. A tricky thing. So we ran this batch file:
Start /HIGH /NODE 1 wpr.exe -start CPU –start Network -filemode –recordtempto S:\temp
ping -n 20 127.0.0.1 > nul
Start /HIGH /NODE 1 wpr.exe –stop S:\temp\profile_is_CPU_Network.etl
If the server you are profile has a lot of RAM (24GB or more), you’ll want to protect your non-paged pool from increasing and harming your server. To do that you should review this blog and add this switch to the start command: –start "C:\Program Files (x86)\Windows Kits\8.0\Windows Performance Toolkit\SampleGeneralProfileForLargeServers.wprp"
We’re starting on NUMA node 1 as the NICs were bound to NUMA node 0 and the “Processor Information” perfmon trace we took earlier showed that the CPUs on NUMA node 0 were locked. We’re starting the recorder with a “high” prioritization so that we can be sure it gets the CPU time it needs to work. We’re not writing to RAM, we’re recording to disk in the hopes that if the trace crashes we’ll at least have a partial trace to use. We made sure that S: in this example was a SAN disk to ensure it had the required speed to keep up with the huge data we’re expecting. We’re pinging 20 times to make sure our trace is 20 seconds long. And finally we’re starting a trace of CPU and Network profiles.
Note that to gather stacks we first had to disable the ability for the Kernel (aka the Executive) to send its own pages of memory out from RAM to the pagefile, where we cannot analyze them. To do this run wpr –disablepagingexecutive on and then reboot.
We retrieved 3 traces in all:
- The first trace to diagnose the problem
- The second trace after 2 changes were made which generated about 50% of our problem
- The final trace after the final change was made which created the other 50% of the problem
Diagnosis
So this blog now becomes a short tutorial on how you can use WPA (Windows Performance Analyzer) to locate the source of DPC issues. WPA is a VERY powerful tool and diagnosing problems is part science, part art. Meaning that no two diagnosis are ever done in the same way. This is just how I used WPA in this case. For this analysis, you’ll need the debugging tools installed and symbols configured and loaded.
CPU Usage (Sampled)\Utilization By CPU
First I want to see which CPUs are pegged. For that we use “CPU Usage (Sampled)\Utilization By CPU”, then select a time range by right-clicking:
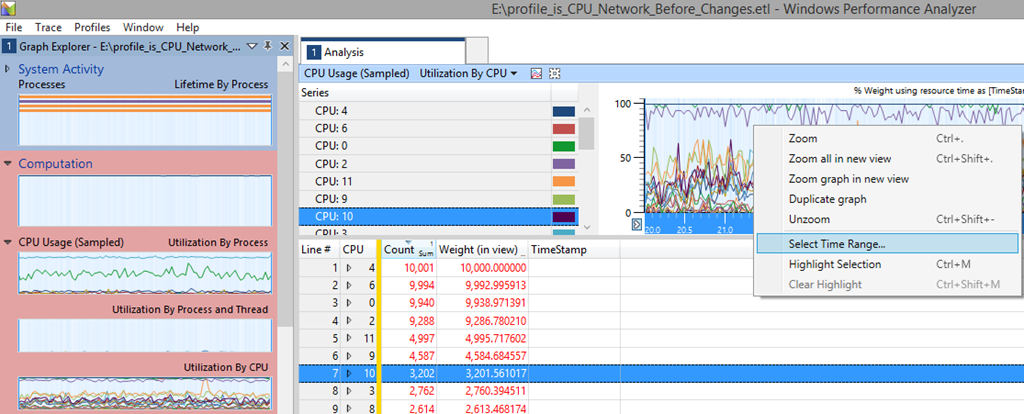
Choose a round number (10 seconds in my example) as it makes it easier to quickly calculate how many things happened per minute when comparing to the graphs for the later scenarios:
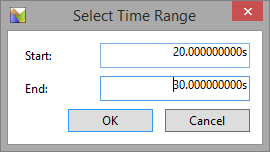
I chose 20 seconds to 30 seconds as it is a 10 second window where there was heavy load and not blips due to tracing starting or stopping. Then “Zoom” by right clicking again.
Now all your graphs will be focused on that time range.
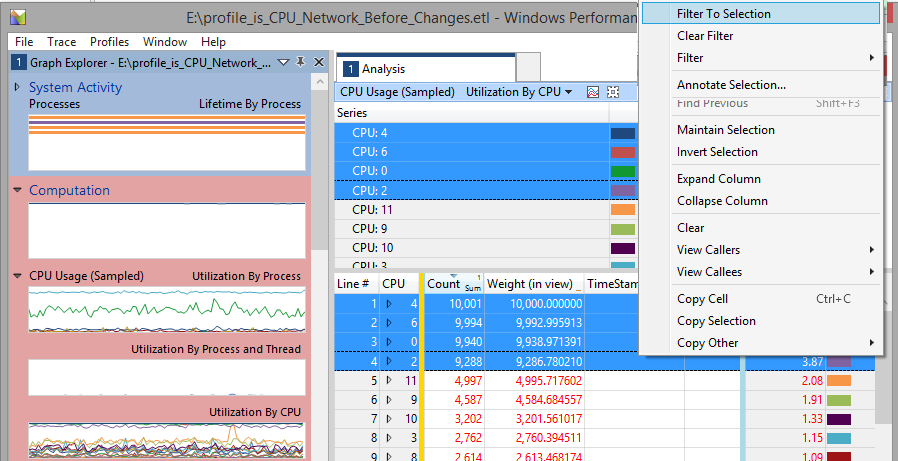
Then shift-select the CPUs which are pegged. In this case it is CPUs 0, 2, 4 and 6. This is because the cores are Hyperthreaded and the NICs cannot interrupt a logical CPU which is the result of Hyperthreading (CPUs 1, 3, 5, 7 etc.). And they are low-numbered CPUs because they are located on NUMA node 0.
Once they are selected, right-click and choose “Filter to Selection”:
Next we want to add a column for DPCs so we can see how much of the CPUs time was spent locked processing DPCs. To add columns, just right click on the column title bar (in the screen above this has “Line # | CPU || Count | Weight (in view) | Timestamp”) on the centre of the right hand pane and select the columns you want to display. Once the DPC/ISR column has been added, drag it to the left side of the yellow bar, next to the CPU column:
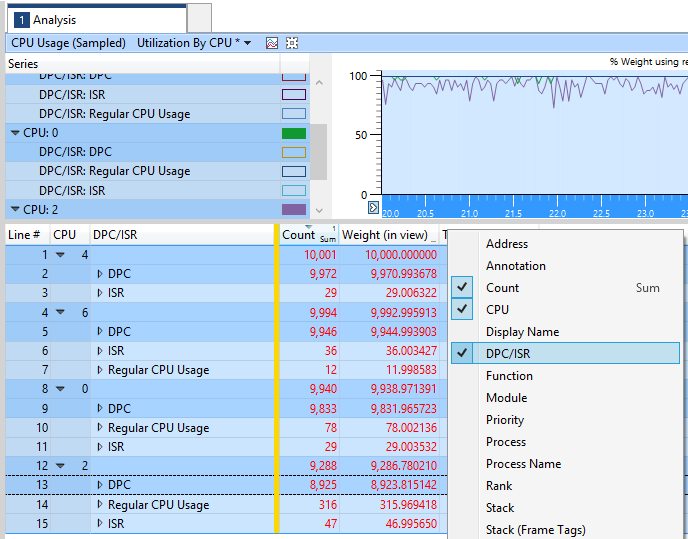
Expanding out the CPU items, we see that DPCs count for almost all of the CPU activity on these CPUs (the count figures for the CPUs activity is 10 seconds of CPU time and the count of CPU time for DPCs under this is over 9 seconds).
DPC duration by Module, Function
The next WPA graph we need is the one which can show how long the DPCs last for. We drag in the first graph under “DPC/ISR” called “DPC duration by Module, Function”:

One the far right column (“Duration”), we can see how long each module spends waiting with a DPC. This says that 36.8 seconds were spent on DPCs for NDIS.SYS alone. How can it be 36.8 seconds if the sample window is 10 seconds? Well, it is CPU seconds, and we have 24 CPUs, so we could potentially have 240 CPU seconds in all.
The next biggest waiter for DPCs is storport.sys. But at 1 second, it’s not even close.
The column with the blue text is called “Duration (Fragmented) (ms) Avg” and is the average time a DPC lasts for during this sample window. The NDIS.SYS DPCs last around 0.22 milliseconds, or 220 microseconds. The count of DPCs for NDIS and storport are comparatively similar (163,000 and 123,000 respectively), but because NDIS took so long on each DPC on average, it ended up locking the CPU for longer than storport did.
So let’s add the CPU column, move it to the left side of the yellow line with it as the first column to pivot on:

We can see that our targeted CPUs, 0, 2, 4. 6 have very high durations of DPC waits (using the last column for “Duration”, again) with no other CPU spending very much time in a DPC wait state. So we select these CPUs and filter.
Expanding out the CPUs, we see that there are many different sources of DPCs, but that NDIS is really the biggest source of DPC waits. So we will now move the “Module” column to be the left-most column and remove the CPU column from view. We then right click on NDIS.SYS and “Filter to Selection” again as we only want to focus on DPCs from NDIS on CPUs 0, 2, 4, 6:

One function, ndisInterruptDPC is causing our DPC waits. This is the one we’ll focus on. If we expand this, it will list every single DPC and how long that wait is. Select every single one of these rows by scrolling to the very bottom of the table (in this example there are 163,230 individual DPCs):

Right click on the column called “Duration” and choose “Copy Other” and then “Copy Column Selection”. This will copy only the values in the “Duration” column. We can paste this into Excel and create a graph which shows the duration of the DPCs as a function of the number of DPCs present:

I have added a red line on 0.1 milliseconds because according the hardware development kit for driver manufacturers, a DPC should not last longer than 100 microseconds. Meaning DPC above the red line are misbehaving. And that this is the bulk of our time spent waiting on DPCs.
So, we have established that we have slow DPCs on NDIS, and lots of them, and that they are locking our 4 CPUs. Our NICs aren’t able to spread their DPCs to any other CPUs and Hyperthreading isn’t really helping our specific issue. But what is causing the networking stack to generate so many slow DPC locks?
DPC/ISR Usage by Module, Stack
The final graph in WPA will show us this. From the category “CPU Usage (Sampled)”, drag in a graph called “DPC/ISR Usage by Module, Stack”. Filter to DPC (which will exclude ISRs) and our top candidates are:

- ntoskrnl.exe (the Windows Kernel)
- NETIO.SYS (Network IO operations)
- tcpip.sys (TCP/IP)
- NDIS.SYS (Network layer standard interface between OS and NIC drivers)
- IDSvia64.sys (Symantec Intrusion Detection System)
- ixn62x64.sys (Intel NIC driver for NDIS 6.2, x64)
- iansw60e.sys (Intel NIC teaming software driver for NDIS 6.0)
To see what these are doing we simply expand the stack columns by clicking the triangle of the row with the highest count, looking for informative driver names and a large drop in the number of counts present, indicating that this particular function is causing a consumption of CPU time.
NTOSKRNL is running high because we are capturing. The kernel is spending time gathering ETL data. This can be ignored.
NETIO is redirecting network packets to/from tcpip.sys for a function called InetInspectRecieve:

TCP/IP is dealing with the NETIO commands above to do this “Receive Inspection”:

NDIS.SYS is dealing with 2 main functions in tcpip.sys: TcpTcbFastDatagram and InetInspectRecieve again:

Other than ntoskrnl, these 3 Windows networking drivers all have entries for the drivers listed as 5, 6 and 7 above in their stacks.
Diagnosis Summary
Lots of DPCs are caused by 3 probable sources:
- Incoming packet inspection by the Symantec IDS system.
- The IDS system has to take every packet, compare it to a signature definition, and, if clean, allow it to pass. This action is causing slow DPCs
- The NIC driver could be stale/buggy and generating slow DPCs.
- There is no evidence for this, but it’s usually a good place to start. There could be TCP offloading or acceleration features in the NIC and/or driver which haven’t been enabled but may improve network performance.
- And finally the NIC teaming software is getting in between the NICs and the CPUs.
- That is, after all, the job of the NIC teaming software: to trick Windows into thinking that the incoming packets from 2 distinct hardware devices are actually coming from 1 device. The problem here, however, is that this insertion into the networking stack is pure software, but is likely causing very slow DPCs
Action Plan
Our actions were to make changes over 2 separate outage windows:
- Update the NIC driver and enable Intel I/OAT in the BIOS of the server.
- I/OAT is described in the spec sheet for the NIC like this: “When enabled within multi-core environments, the Intel Ethernet Server Adapter X520-T2 offers advanced networking features. Intel I/O Acceleration Technology (Intel I/OAT), for efficient distribution of Ethernet workloads across CPU cores. Load balancing of interrupts using MSI-X enables more efficient response times and application performance. CPU utilization can be lowered further through stateless offloads such as TCP segmentation offload, header replications/splitting and Direct Cache Access (DCA).”
- Uninstall the NIC teaming software
- 3rd party NIC teaming software inhibits many TCP offloading features, and in this case generates large numbers of slow DPCs
- On the second outage we uninstalled the IDS system.
- IDS was not configured on this (and all other) servers. But as the software had the potential to become enabled, it was grabbing every incoming packet for inspection, despite the fact that it wasn’t configured to inspect the packet or act on violations in any way. Stopping the service is insufficient, the driver must be removed from the hidden, non-plug and play section of the device manager. Manually removing the driver isn’t sufficient. The software will reinstall it at next boot. Only a full uninstall will do.
After dissolving the NIC Team
Here is what the picture looked like after we dissolved the NIC team, updated the NIC driver and enabled Intel I/OAT in the BIOS.

In this 10 second sample we can see that the 4 CPU cores are still effectively locked as the CPU time due to NDIS DPCs is 37.7 seconds (out of a possible maximum of 40 seconds. The number of DPCs has decreased by more than half to 55,000, meaning that the average duration of DPCs has become very long at 682 microseconds – triple the average time from before we removed the NIC team and enabled I/OAT.

The blue area of the graph above is the picture we had from before changes were made. The pink/orange area is the picture of DPC durations after removing NIC teaming and enabling I/OAT.
So why did the average duration of DPCs get longer?
It could be that the IDS software now does not need to relinquish its DPCs to make room on the same CPU cores as the DPCs for the NIC teaming driver. These 2 drivers must be locked to the same CPUs. With no need to relinquish a DPC due to another DPC of equal priority, the IDS DPCs are free to use the CPU for longer periods of time before being forced off.
At any rate, it certainly isn’t fixed yet.
After uninstalling Symantec IDS
And finally here’s what the picture looked like after we uninstalled the IDS portion of the Symantec package. Remember, this service was not configured to be enabled in any way.

You can see that the average time has dropped from 220 microseconds to 90 microseconds – below the 100 microsecond threshold required by the Driver Development Kit.
In this 10 second sample there were 127,000 DPCs from NDIS on the 4 heavily used CPUs, but the CPU time they consumed was 11 seconds, a reduction from 36.8 seconds.

The blue area of the graph above is the picture we had from before changes were made. The pink/orange area is the picture of DPC durations after removing NIC teaming and enabling I/OAT. And the green area is the picture after IDS is removed.
This is a dramatic improvement. Nearly all DPCs are below the 100 microsecond limit. The system is able to process the incoming load without locking up for high priority, long lasting DPCs.
What about RSS?
We’re not quite done though. 4 of our CPUs are still working very hard, often pegged at 100%. But why only 4? This is a 2-socket system with 6 cores on each socket. That gives us 12 CPUs where we can run DPCs. DPCs from one NIC are bound to one NUMA node. We already dissolved our NIC team, so we only have 1 NIC in action, so we are limited to 6 cores. RSS can spread DPCs over CPUs in roots of 2, meaning 1, 2, 4, 8, 16, 32 cores. Meaning we can at most use 4 CPUs per NIC.
To scale out we would need to add more NICs and limit RSS on each of those NICs to 2 cores. We’d need to bind 3 NICs to NUMA node 0 and 3 to NUMA node 1. We’d also need to set the starting CPUs for those NICs to be cores 0, 2, 4, 6, 8 and 10. In that we can saturate every possible core.
But to do this, we’d need to ensure that we can have multiple NICs, without using the teaming software. Which means we’d need to assign each NIC a unique IP address. To do that we need to make sure that the TSM clients can deal with targeting a server name with multiple IP addresses in DNS for that name. And if connectivity to the first IP address is lost, that TSM can failover to one of the other IP addresses. We’ll test TSM and get back with our results later.
But we need one more fundamental check before doing that: We need to make sure that the incoming packet, hitting a specific NUMA node and core is going to end up hitting the right thread of the TSM server where that packet is going to be dealt with and backed up. If we can’t align a backup client to the incoming NIC and align that NIC to the backup software thread that should process it, then we’ll be causing intra-CPU interrupts, or worse yet, cross NUMA interrupts. This would make the entire system much less scalable.

So this is how this would all look. The registry key to set the NUMA node to bind a NIC to is “*NumaNodeId” (including the * at the start). To set the base CPU, use *RssBaseProcNumber”. To set the maximum number of processors to use set “*RssBaseProcNumber”.
These keys are explained here: https://msdn.microsoft.com/en-us/library/windows/hardware/ff570864(v=vs.85).aspx
and here: Performance Tuning Guidelines for Windows Server 2008 R2
And more general information on how RSS works in Windows Server 2008 are here: Scalable Networking- Eliminating the Receive Processing Bottleneck—Introducing RSS
Our problem in the above picture, however, is that our process doesn’t know to run its threads on the NUMA node and cores where the incoming packets are arriving. Had this been SQL server, we could have run separate instances configured to start using specific CPUs. Hopefully, one day, TSM will operate like this and become NUMA-node aware.
I know this has been a long post, but for those who have read down to here, I do hope this has helped you with your troubleshooting using WPT.