Is my OpsMgr data warehouse running behind?
Our team recently got a call from one of our reporting users with a problem. She said that her queries against the OpsMgr data warehouse (DWH) weren't returning data within the past 10 days. Upon further discussion she indicated that she was seeing this problem in the hourly and the daily data aggregations, and although the raw data was up-to-date it was entirely impractical to use due to how long those tables took to query.
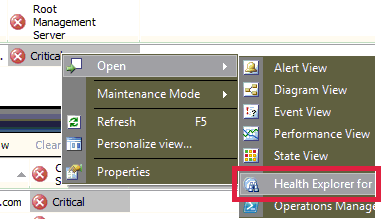
So I set to digging. I started by reviewing the "Operations Manager -> Management Server -> Management Server State" view and there I found that a number of management servers were yellow or red. Right-clicking on the state icon in the root management server column lead me to the Health Explorer for the RMS and that showed me that the state issues was due to data warehouse related workflows. My assumption at this point was that these two things were related and I wanted to understand how.
The workflows that were driving the state of the root management server down specifically were Data Warehouse Performance Data Collection Writer Recovery State and Data Warehouse Performance Data Collection Writer Periodic Data Maintenance Recovery State. Using the state change events tab in the Health Explorer I found more details about the events that were driving state. In the case of both monitors the events that triggered the state change included details about a failing workflow with the ID of Microsoft.SystemCenter.DataWarehouse.CollectPerformanceData so I decided I needed to learn more about what that did.
To get at the details of the workflow I used the command shell. First step was to get the rule object:
PS Monitoring:\
>$rule = get-rule -criteria "Name = 'Microsoft.SystemCenter.DataWarehouse.CollectPerformanceData'"
PS Monitoring:\
>$rule.DisplayName
Performance data collector
From there I used the rule to get the management pack
PS Monitoring:\
>$mp = $rule.GetManagementPack()
PS Monitoring:\
>$mp.Name + " -- " + $mp.DisplayName
Microsoft.SystemCenter.DataWarehouse.Library -- Data Warehouse Library
Lastly I exported the MP to XML so I could search over the file
>$mp | Export-ManagementPack -Path c:\temp\
PS Monitoring:\TK5SCOMMG2RMS
>dir c:\temp\Microsoft.SystemCenter.DataWarehouse.Library.xml
Directory: C:\temp
Mode LastWriteTime Length Name
---- ------------- ------ ----
-a--- 2/19/2011 8:05 PM 1985154 Microsoft.SystemCenter.DataWarehouse.Library.xml
Glossing over the gory details of the MP's XML, I unwound the data sources and write actions in the management pack and got the pointer to go look at the Perf.PerformanceStage table in the data warehouse. Outside of that though, this was largely a dead end. So I turned to the blogmosphere to see what I could come up with.
Piecing together details I got from a forum post from Micahel Pearson (a tester on the performance team within the OpsMgr PG), some "ramblings" from Pete Zerger (OpsMgr MVP and System Center Central top contributor), a couple posts (1|2) from Kevin Holman and an online excerpt from the System Center Operations Manager 2007 Unleashed book, I then had some "solid leads" cup raneth over. I played with some of the queries I'd amassed from my searches and after digging into the data warehouse I came up with two key things.
The first is the following query which lists the data sets in the data warehouse, which have aggregation, and provides some useful bits of information about them:
 USE OperationsManagerDW;


WITH AggregationInfo AS (

    SELECT

    AggregationType = CASE

        WHEN AggregationTypeId = 0 THEN 'Raw'

        WHEN AggregationTypeId = 20 THEN 'Hourly'

        WHEN AggregationTypeId = 30 THEN 'Daily'

        ELSE NULL

    END

    ,AggregationTypeId

    ,MIN(AggregationDateTime) as 'TimeUTC_NextToAggregate'

    ,COUNT(AggregationDateTime) as 'Count_OutstandingAggregations'

    ,DatasetId

    FROM StandardDatasetAggregationHistory

    WHERE LastAggregationDurationSeconds IS NULL

    GROUP BY DatasetId, AggregationTypeId

)

SELECT

SDS.SchemaName

,AI.AggregationType

,AI.TimeUTC_NextToAggregate

,Count_OutstandingAggregations

,SDA.MaxDataAgeDays

,SDA.LastGroomingDateTime

,SDS.DebugLevel

,AI.DataSetId

FROM StandardDataSet AS SDS WITH(NOLOCK)

JOIN AggregationInfo AS AI WITH(NOLOCK) ON SDS.DatasetId = AI.DatasetId

JOIN dbo.StandardDatasetAggregation AS SDA WITH(NOLOCK) ON SDA.DatasetId = SDS.DatasetId AND SDA.AggregationTypeID = AI.AggregationTypeID

ORDER BY SchemaName DESC
The results look like the following:
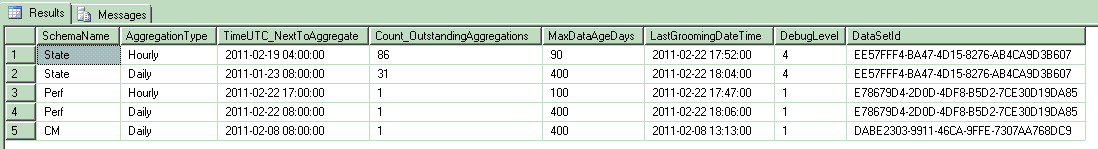
The columns in the results are:
- SchemaName: This is the name of the data set (e.g. perf, state, some other custom data set, etc.). You'll note that alerts and events don't show up here and that is because those data sets don't have aggregated tables
- AggregationType: Data sets can be aggregated into different levels of granularity and this query shows the results for each type of aggregation (e.g. hourly, daily)
- TimeUTC_NextToAggregate: This is the timestamp in UTC format, of the next time interval to be aggregated. Note: For the daily aggregation type, you can just look at the YYYY-MM-DD value and disregard the rest
- Count_OutstandingAggregations: This is how many aggregations the data set is behind. If you see values between 1 and 3 then you're effectively caught up. If (as is the case with State above) you see bigger numbers, then you've fallen behind
- MaxDataAgeDays: This is the retention policy that is set for the given data set's aggregation
- LastGroomingDateTime: Pretty straight forward
- DebugLevel: I never knew this, but apperantly you can turn up the debug levels on data sets and get something like tracing going to diagnose problems. This I will cover in a later blog post. The key takeaway here is, you only want this turned on for short periods of time and if you see a value higher than 0 on a data set you are not investigating then set it back to 0
- DataSetId: This is the GUID of the data set which will come in handy later
With that I had a much better way of understanding my data sets and whether they were caught up or not. I then turned my attention to the question of, "how do I manually run data warehouse grooming and aggregation to help my warehouse catch up?" I started with some tsql that Kevin provides in his blog post about 31552 events and altered it to account for the fact that I needed to run the maintenance SPROC numerous times since I was numerous hours/days behind. Following is the loop I came up with, which runs against the OperationsManagerDW database on the DWH server:
 USE OperationsManagerDW


DECLARE @DataSetName varchar(50)


-- Set this string to the "SchemaName" value that is behind

SET @DataSetName = 'State'


WHILE (

    (SELECT COUNT(AggregationDateTime)

    FROM StandardDatasetAggregationHistory AS ah WITH(NOLOCK)

    INNER JOIN StandardDataSet AS ds WITH(NOLOCK) ON ah.DatasetId = ds.DatasetId

    WHERE ds.SchemaName = @DataSetName

    AND LastAggregationDurationSeconds IS NULL) > 1

)

BEGIN

    BEGIN TRANSACTION;


    USE [OperationsManagerDW]

    DECLARE @DataSet uniqueidentifier

    SET @DataSet = (SELECT DatasetId FROM StandardDataset WHERE SchemaName = @DataSetName)

    EXEC StandardDatasetMaintenance @DataSet


    COMMIT TRANSACTION;

END
IMPORTANT NOTES: This job runs continuously until aggregation is caught up, and while it runs it can cause significant blocking in the data warheouse DB. The DWH DB should be able to handle it, but you will want to keep a close eye on overall server performance. Likewise, in my experience this loop would occasionally get elected as the deadlock victim so I had to restart it from time to time. Lastly, its also important to note that standard dataset maintenance covers all aggregation types for the data set, and performs aggregation in order from smaller aggregation to bigger aggregations. In other words, by running maintenance on the "Perf" data set, it will take care of the hourly aggregation first and then once that is caught up it will turn its attention to the daily aggregations.
Conclusion
In the end, our data sets had fallen so far behind that it took us about a week straight of babysitting the loop above to get all caught up on performance data. While the loop ran I used the handy query above to watch progress, which was a vast improvement from taking MAX(TimeStamp) values from the DWH views themselves. Going forward we're considering how we can better monitor our data sets and their aggregations to be more proactive about learning when we've fallen behind. If we come up with something, I'll certainly share it here. If you come up with something before I do, then I'd greatly appreciate hearing about it!
[Related Instrumentation: Source: Health Service Modules, Event ID: 31552; Source: HealthService, Event ID: 2115]