Orchestrator 2012 Logging and Debug Logging
Hi All,
If you’ve started playing with Orchestrator I have detailed the areas where you can look for issues with your Runbooks and other components.
Runbook Designer
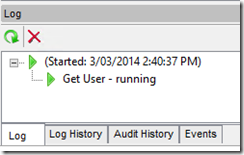
Log Tab
Firstly you can look at the Log tab while you’re Runbook is executing
Log History Tab
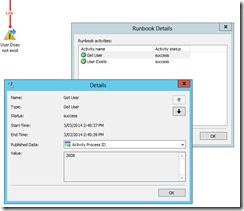
Or after it is complete you can check the Log History tab
Double Click on the entry you want to review and then check the status for each Activity.
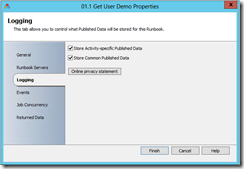
To control the level of Detail available you need to go to the properties of each individual Runbook and select Store Activity-specific Published Data and or Store Common Published Data. NOTE This is only recommended in Dev and Test not production as these may significantly increase the size of your database (See the following TechNet reference for details. Database Sizing and Performance )
Do not have these turned on in Production unless you are troubleshooting.
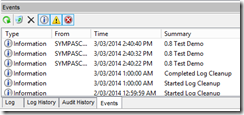
Events
We can also get some useful information from the Events tab
Log Files
Another area is the component logs for Debug Logging.
Thankyou to Jeffrey Fanjoy who is a senior support escalation engineer based out of the US for this information.
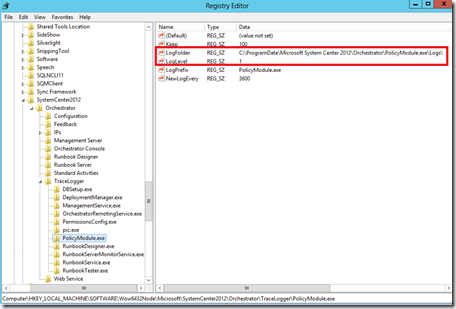
if you go to the following Registry key
HKEY_LOCAL_MACHINE\SOFTWARE\Wow6432Node\Microsoft\SystemCenter2012\Orchestrator\TraceLogger
on a box with the Runbook Designer or Runbook Server you will see that for each component there is a LogFolder and LogLevel key. The LogFolder shows you where the actual log sits and the LogLevel is the actual Verbosity level. (NOTE You may need to restart services/ the server before this will take affect.)
Log Level |
Detail |
| 1 | Errors |
| 3 | Errors and warnings |
| 7 | Errors, warnings and Information |
Just keep in mind that the higher the verbosity the more information that will get put into the log so it should only be used for troubleshooting purposes and should not be left on by default.
