How to create a “black box” performance counter data collector
I highly encourage my customers to run a “black box” performance counter data collector set on their Windows Servers. The purpose of it is to continuously collect a detailed amount of data about the system in a circular file buffer of adjustable size so what if/when the system has a performance problem, we have roughly 24 hours of data leading up to the problem.
This article is a walk through of how to create a performance counter data collector set template with all of the performance counters used by industry experts, how to import the template onto a local or remote system, and how to automatically start the data collector set at Windows start up – Performance Monitor does not have a feature to automatically start a data collector set after a reboot.
This procedure was tested on Windows 8.1 and Windows Server 2012 R2, but should work fine on Windows Vista, Windows Server 2008, and later operating systems.
Create a “black box” performance counter data collector template
First, determine the Microsoft products and services installed on the target system. In this example, I have a customer who needs a data collector set template for a Microsoft Windows Server 2012 R2 system running a named instance of Microsoft SQL Server 2012. Therefore, I want to target performance counters for both Windows Server 2012 R2 as well as SQL Server 2012.
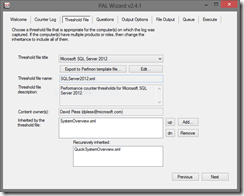
Arguably the easiest way to do this is to install the Performance Analysis of Logs (PAL) tool – an open source project/tool of mine. It requires Powershell 2.0 and the Microsoft Chart Controls for the .NET Framework 3.5 – both are free products from Microsoft. Once installed, run the PAL Wizard from the Windows Start menu and navigate directly to the Threshold File tab. Select a threshold file or combination of threshold files (they can be mixed and matched through the inheritance pane, and click the Export to Perfmon template file button.
In this case, I selected Microsoft SQL Server 2012 which already has an inheritance of System Overview and Quick System Overview which are good for all Microsoft Windows operating systems.
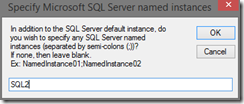
Since SQL Server might have named instances, the PAL tool detected SQL counters and prompts me to name any SQL named instances.
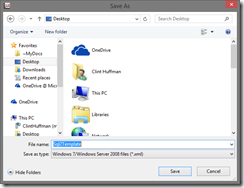
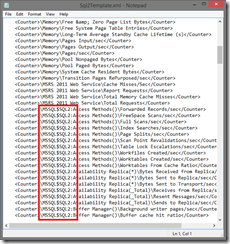
In this case, I specified “SQL2” and saved it as an XML file which is the format that Windows Server 2008 and later uses for counter log templates. Once the XML file is saved. Optionally, open it in Notepad to verify that it has the counters that you expect to see.
This template is a good start, but will require additional modifications to make it a circular log.
Create a performance counter data collector using the template
Copy the XML template that you created in the previous step to a file system or network share location that is accessible to your domain account. This could be the a local disk drive on your workstation, a local disk drive on the target system, or a network share that your workstation or the target server has access to.
On your workstation or at the console of the target system, open an Administrator command prompt. This procedure requires administrator rights on the target system.
Run the following command to create a data collector using the template:
logman import <NameOfDataCollectorSet> -xml <PathToXmlTemplate> -s <NameOfTargetSystem>
Here is an example of me creating the data collector set named, “SQL2_Blackbox_darksteel” (the %computername% resolves to the local computer name using the template I created earlier, “Sql2Template.xml”, on a remote system called, “darksteel”.
Run the following command to check if the data collector set was created:
logman query
Note that the data collector set has not been started yet. Do not start it just yet.
Update the data collector set to be in binary circular format with a log file maximum size of 300 MB or a size that you prefer.
logman update <NameOfDataCollectorSet> –f bincirc –max <SizeOfLogInMB>
Now, the data collector set can be started and left to run forever without ever being larger than the size specified.
Optionally, the output location can be changed using the following sample command:
logman update SQL2_Blackbox_DARKSTEEL -o D:\Perflogs\SQL2_Blackbox_DARKSTEEL.blg
This file path is in respect to the file system on the target system – not the workstation from which the command might be running.
Important: Ensure that the output directory location does not already contain data. Performance Monitor’s Data Management features might delete data at that location.
To start the data collector, run the following command:
logman start <NameOfDataCollectorSet>
Setup the data collector set to start on the startup of Windows
Unfortunately, Performance Monitor does not provide a way to automatically start the data collector set after a reboot. This means all of your hard work of creating a “black box” data recorder will be for nothing after someone reboots the system. In this step, we will setup the data collector set to automatically start when Windows starts by using Task Scheduler.
Run the following command in order to have the data collector set automatically start after a reboot:
schtasks /create /tn <NameOfDataCollectorSetOrAUniqueName> /sc onstart /tr "logman start <NameOfDataCollectorSet>" /ru system /S <NameOfTargetSystem>
Note: The /S parameter of schtasks can be used to create this task on a target, remote, system.
Now the data collector set will automatically be started when the system starts.
Setup the data collector set to delete the oldest log file when low on disk space
By default, data collector sets will create a unique counter log each time it is started. This is to prevent the deletion of the existing logs. This is a nice feature, but this can result in several log files that might just be taking up too much disk space.
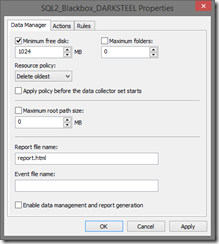
To setup the data collector set to delete the oldest log file when the disk space is low, open Performance Monitor (Start, Run, Perfmon.exe). Expand Data Collector Sets, expand User Defined and select the data collector set you wish to target for this. Right click on the data collector set and click Data Manager.
In this case, I setup the data collector set to delete the oldest counter log file.
Important: This setting can potentially delete existing data in the output directory location. Ensure that the output directory location *only* contains counter log files for this data collector. Avoid paths such as the root of a disk drive.
Conclusion
After following these steps you will have a data collector set that can run indefinitely without running the system out of disk space – it stays at the maximum size or smaller. Just stop the data collector set (the data collector set must be stopped before moving the counter log file otherwise it can result in file corruption) and analyze the counter log with the Performance Analysis of Logs (PAL) tool.
Want more? These procedures and *much* more is covered in my book, “The Windows Performance Analysis Field Guide” due out in August 2014.
