How to create a threshold file for the PAL tool
The Performance Analysis of Logs (PAL) tool is an open source project at https://pal.codeplex.com that analyzes performance counter logs. It has thresholds for performance counters written by experts in their respective areas spanning nearly all of the major Microsoft Server products, some Citrix XenApp,, VMware. and others. The number of products covered is limited to only those willing to create a threshold file to define it. It’s my hope that this article will help enable you to create your own threshold file and together we can create prescriptive guidance on all of the performance counters.
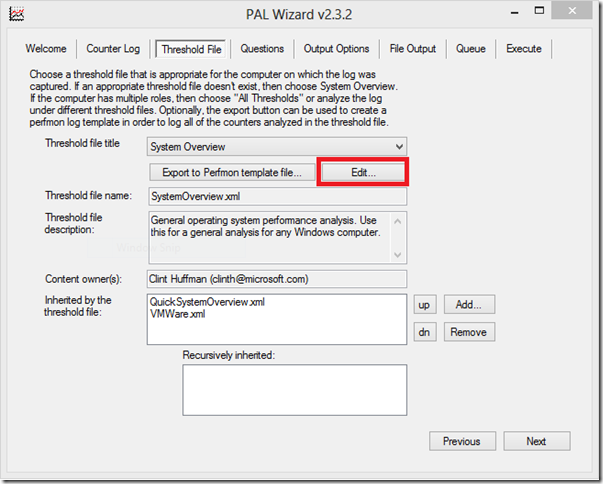
First, open the PAL Wizard as you normally would to analyze a counter log and navigate to the Threshold File tab and click “Edit…”. It doesn’t matter which threshold file is selected at this time. The PAL Editor will show.
Figure 1: The Threshold File tab in the PAL Wizard.
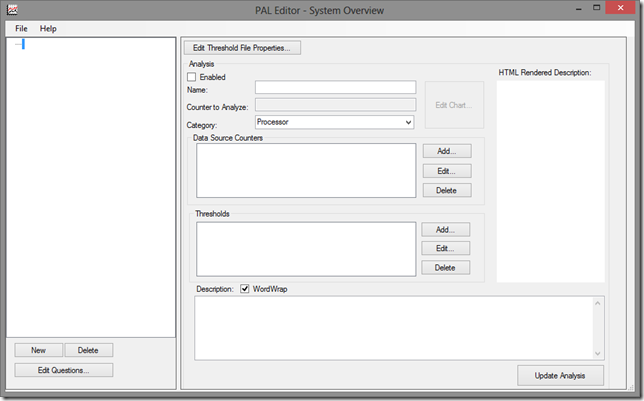
In the PAL Editor, go to the upper left and click File, New.
Figure 2: The PAL editor after clearing it with File, New.
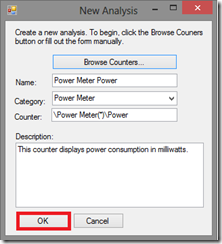
This clears the editor, but hasn’t created a new threshold file just yet. We will get to that. For now, lets create a new analysis by clicking the New button at the lower left of the editor. This will show the counter New Analysis dialog box. An analysis is the primary container for one or more data source counters that you want to analyze, the thresholds that are applied to the “counter to analyze”, and the charts generated for the data source counters.
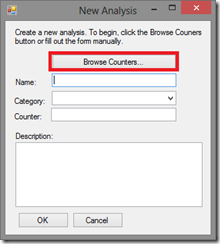
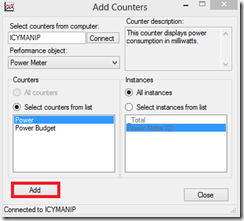
Figure 3: The New Analysis and Add Counters dialog boxes showing the buttons to click to add new counters to a new analysis.
Click the Browse Counters button and this will open the Add Counters dialog box. This interface allows you to connect to a computer either local or remotely that has the performance counter that you want to add. It’s important to the PAL tool connects to computer that has the counter to ensure that the counter path is exact. Click Close or OK to all of the open dialog boxes to continue.
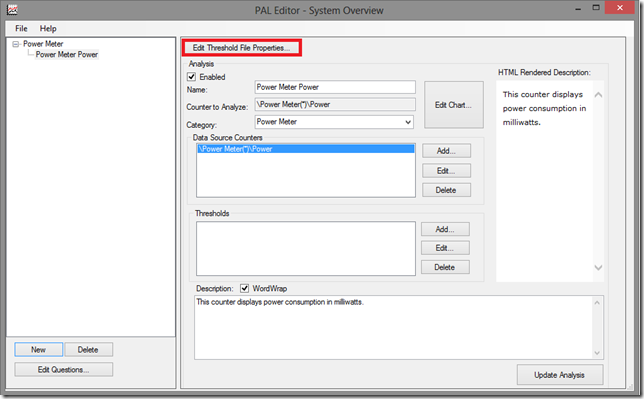
Once at the main editor again, notice that many of the fields have been populated with data from the selected counter. This is a good opportunity to update the description of the analysis to tell the end users the purpose of this analysis, what is being checked and why, and what do to if the thresholds are exceeded. The description field supports the use of HTML tags and the rendered HTML can be previewed on the right pane. The text in the description will always show in the PAL report with this analysis. Once finished with editing the description, click the Update Analysis button to set the change and click File, Save to permanently save the changes to the threshold file.
In this case, I am adding all of the instances of the \Power Meter(*)\Power performance counter. Once I click OK, you are returned to the main PAL editor and should now see the performance counter that you added on the left pane.
Excluding counter instances
In some cases, it is necessary to exclude specific instances of a performance counter. For example, the _Total counter instance of the LogicalDisk counter object is commonly excluded because the _Total instance sums all of the logical disk counter values together which is typically not helpful when trying to analyze each disk. To exclude a counter instance, select the data source counter to edit, then click the Edit button.
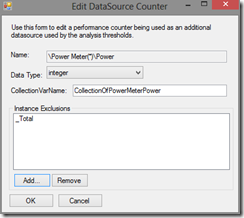 Figure 4: The Edit DataSource Counter form in the PAL editor.
The Edit DataSource Counter form will show. Click the Add button and specify the counter instance to exclude. Repeat as many times as necessary to define all of the counter instances to exclue. In this case, I excluded the _Total instance. Click OK when finished.
Figure 5: The PAL editor with a new analysis.
Now is the time to save the work as a new threshold file. At the top left, click File, Save As. This opens the Save As dialog box that will allow you to save the work you’ve done so far to an XML file that is the new threshold file. Navigate to a folder that you have write permissions to such as your Desktop or a location under your My Document folder. In the File Name field, type in a file name that you want the threshold file to have and click Save. Once saved, move the file to the folder where PAL is installed. This typically requires elevated privileges. The default installation folder for PAL is C:\Program Files\PAL\PAL. Saving files directly to this folder is typically prevented by Windows unless you use elevated privileges. In this case, I saved the threshold file as PowerStates.xml and I saved it to the PAL installation folder.
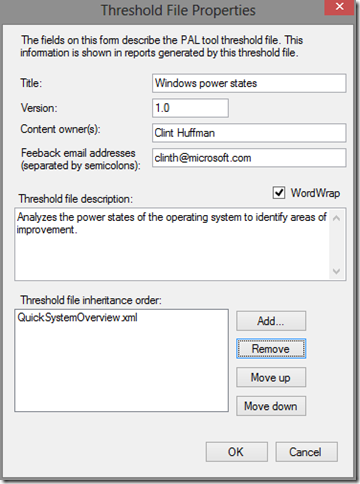
Next, let’s give the threshold file a name and other information. Click the Edit Threshold File Properties… button. In the Threshold File Properties dialog, change the Title field to a more presentable name. In this case, I named mine, “Windows power states”.
Title: This is the name of your threshold file that will be shown. This must be a unique name relative to the other threshold file names. A title with the name of the manufacturer, product, and product version that the threshold file focuses on such as Microsoft IIS8 is recommended.
Version: This starts off as 1.0. Increment the major and/or minor version numbers when significant changes are made to your threshold file.
Content owner(s): You are the content owner… the one who’s reputation is behind this threshold file. Put your name and names of other contributors in this field.
Feedback email addresses: Put your email address or addresses separated by semicolons (;) that you would like users to contact you for support or questions.
Threshold file description: This is a sentence or two describing purpose of the threshold file.
Threshold file inheritance order: There is no need to recreate all of the thresholds of the other threshold files. Simply inherit from all of the threshold files that you want. I generally recommend inheriting from at least the Quick System Overview threshold file because it contains all of the threshold for the core operating system. For example, Microsoft BizTalk Server depends on SQL Server and IIS, so it inherits from the SQL Server and IIS threshold files. When a change is made to any of the inherited threshold files, your threshold file automatically gets those changes allowing your threshold file to evolve with the other threshold files.
The order that the threshold files are listed is used to resolve conflicts where the two or more threshold files have an analysis with the same name or same identifier (in the XML only – not exposed by the editor). Your threshold file is always applied last meaning it will always win conflicts. This means that if you don’t agree with the logical disk latency thresholds defined in the Quick System Overview, then all you have to do is defined an analysis with the same name and create your own thresholds which will override the inheritance. This is what the Microsoft Exchange Server threshold files do because they have more restrictive threshold for disk latency than what the Quick System Overview threshold has defined. With that said, the Exchange Server threshold file still gets all of the other thresholds defined in the Quick System Overview threshold file.
To add a threshold file to inherit from, click the Add button, browse to the PAL installation folder, and select one of the threshold files listed there, then click Open. You should see the threshold file name listed in the inheritance order. If necessary use the Move up and Move down buttons to change the order in which the threshold files are applied. Remember, your threshold file will be applied last allowing it to win any conflicts in analysis names.
Figure 6: The Threshold File Properties dialog box.
In my case, I added the QuickSystemOverview.xml file. Click OK when finished. For good measure, save your work so far by clicking File, Save in the main PAL editor.
At this point, the threshold file is usable and you should find it in the drop down menu on the PAL Wizard, but when no thresholds are defined, the counter will only show a chart and statistics only.
Next, let’s add question variables to the threshold files.
Question variables (optional)
Question variables allow you to ask the end user more information about the computer system(s) where the counter log was captured that cannot be retrieved by any other means. The answer provided by the user can by used by thresholds in your threshold file for a more thorough analysis. For example, you could ask the user what phase of the moon it was when the counter log was captured.
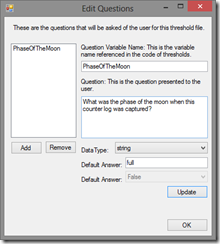
To add a question variable, click the Edit Questions button on the main PAL editor. Edit Questions will show. Click Add and “-Needs Updated-“ will show. Click “-Needs Updated-“ and replace the default data on the right as appropriate.
Question Variable Name: This is the variable name that will be used in the threshold code. Ensure that the name meets the variable naming requirements of PowerShell such as no spaces in the name.
Question: This is the question that is presented to the end user.
DataType: Choose Boolean or String. Boolean provides a True or False value type for the variable. String provides a text value type for the variable.
Default Answer: If no answer is provided by the end user, then this is the default response to the question.
Figure 7: The Edit Questions form
Click Update, then OK when finished and do another File, Save for good measure.
Adding a threshold (optional)
To add a new threshold to an analysis, click the Add button in the Thresholds group. This will open the Add Threshold Properties.
Name: This is the name of the threshold and is the text that shows with all alerts generated by this threshold. Make this a concise description.
Condition: Choose Warning or Critical. Use Warning to alert the user that a critical threshold is near, there might be an ambiguous condition that could lead to a larger problem, or when the threshold is experimental. Use Critical when it is clear that there is a problem or a condition that the user must be made aware of. Notice that when the condition is changed, the priority changes. This is because Critical conditions are more important than Warning conditions.
Color: This will always be yellow for Warning or red for Critical conditions.
Priority: You can add as many thresholds as you want to an analysis, but if more than one threshold is broken, then only one threshold will win to produce an alert. When multiple thresholds in an analysis are broken, the threshold with the highest priority will win – meaning the name, condition, and color of the “winning” threshold will be used in the alert generated from the broken threshold(s).
Variables: This is a list of variables and descriptions of those variables that can be used in the PowerShell Threshold Code. These could be question variables such as the $PhaseOfTheMoon variable that I created earlier.
PowerShell Threshold Code: This is where nearly any PowerShell code can be added towards analyzing the “counter to analyze” data source counter. It can be as simple or as advanced as you prefer. By default, PAL provides a “ready to use” threshold by automatically adding the appropriate arguments to the StaticThreshold function. It defaults with a threshold of greater than 10. All of the lines that precede with “#//” are comments and can be removed. They are there only to provide as help.
Note: Please keep in mind that the threshold code can be much more advanced than the standard StaticThreshold. For examples of advanced threshold code, explore the Process Private Bytes analysis of the System Overview threshold file.
StaticThreshold: This is a function inside of PAL.ps1 that will automatically compare the operator and threshold arguments to the values of the “counter to analyze” counter and will generate an alert each time the threshold is exceeded.
CollectionOfCounterInstances: This value must be the variable that contains all of the instances of the “counter to analyze” counter which is automatically named and provided.
Operator: This is a string type that accepts less than ‘lt’, less than or equal to ‘le’, greater than ‘gt’, or greater than or equal to ‘ge’.
Threshold: This must be an integer or double type that will be compared against the values of the “counter to analyze” counter.
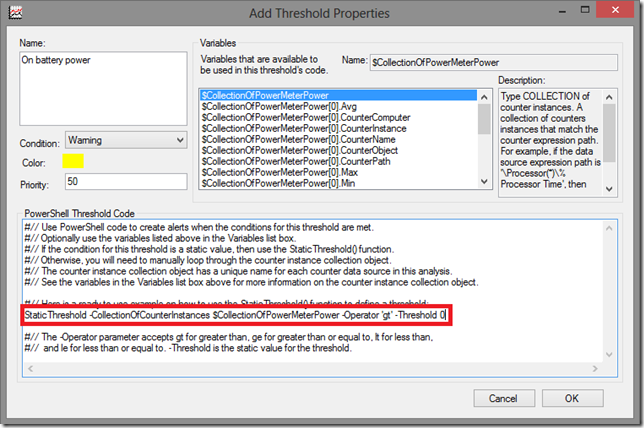 Figure 8: The Add Threshold Properties form.
Click OK when finished and the threshold should appear in the Thresholds section of the main PAL editor. Click the Update Analysis button on the lower right of the PAL editor, then click File and Save to save your changes.
At this point, the threshold file can be used and if any of the thresholds are exceeded, then they will throw an alert with the corresponding conditions of the threshold.
Adding visual thresholds to the chart (optional)
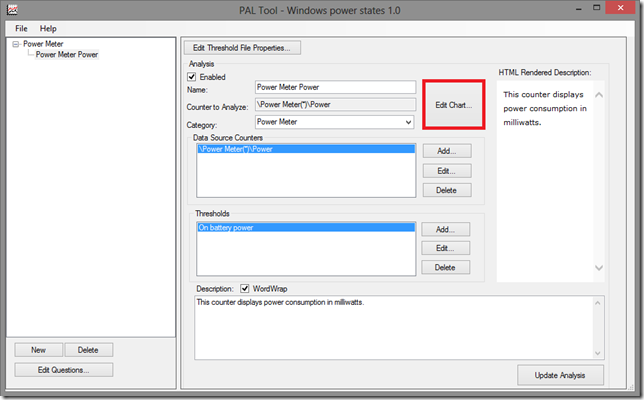
If you are adding thresholds to an analysis, then it is highly recommended to add corresponding visual thresholds into the chart or charts generated for the analysis. On the main PAL editor form, click the Edit Chart button on the upper right.
Figure 9: The main PAL editor form highlighting the Edit Chart button.
This will show a new form that allows you to create a Warning threshold and/or a Critical threshold into the chart or charts generated for this analysis. These thresholds will show as yellow and red gradients with the ranges specified in this form. Like the counter thresholds, by default, the visual chrart thresholds of Warning and Critical are automatically generated and usable. You can enable one or both of them by clicking the Enabled combo box next to the respective threshold.
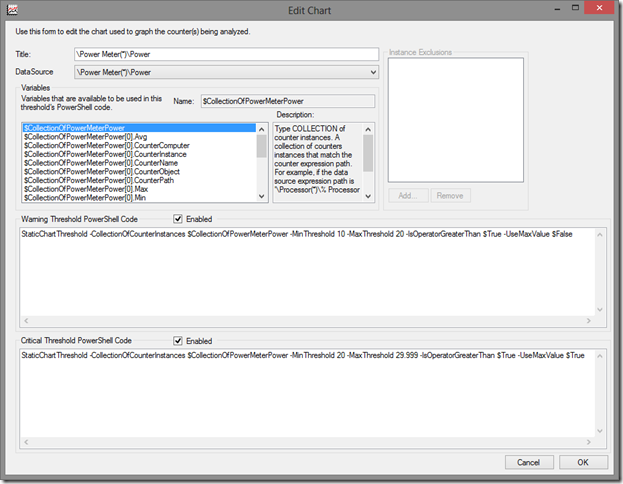 Figure 10: The Edit Chart form in the PAL editor.
StaticChartThreshold: This is a function in PAL.ps1 that can be called to create the visual thresholds seen as gradients on the analysis charts.
CollectionOfCounterInstances: This argument requires the variable that contains all of the counter instances of the “counter to analyze”. It is recommended to only use the variable already provided.
MinThreshold: This is the lowest value of the respective Warning and/or Critical chart threshold.
MaxThreshold: This is the highest value of the respective Warning and/or Critical chart threshold. If the maximum value of Critical or Warning (if Warning is the only threshold) is 30 and if none of the counter values reach 30, then the chart will automatically expand to 35 which makes the placement of the gradient seem off. Therefore, consider using a value ending in .999 such as 29.999 to represent 30.
IsOperatorGreaterThan: This is a Boolean (true|false) argument. If True, then it is assumed that the greater the counter value, the worse the condition leading from yellow [Warning] to red [Critical] as the value increases. If False, then the effect is inverted – meaning lower values are considered a worse condition leading from yellow to red in a downward view.
UseMaxValue: This is a Boolean (true|false) argument. If True, then if this chart threshold is exceeded by the counter value, then this chart threshold is increased automatically to match the counter value. If False, then the chart threshold values will not change on the chart. When using both Warning and Critical chart thresholds, it is recommended to set the Warning chart threshold to False and set the Critical chart threshold to True allowing the Warning threshold to stay in place and the Critical threshold to continue to increase matching the counter value if it had exceeded the MaxThreshold value for Critical.
Once finished, click OK to return to the main PAL editor, click Update Analysis on the lower right, then File, Save to permanently save your changes to the threshold file.
At this point, the analysis should be relatively complete and should be tested. When working with many analyses within a threshold file, consider using the Enabled combo box near the top of the analysis to enable or disable the analysis. This is helpful when needing to test some, but not all of the analyses in your threshold file.
Generated counters (optional)
The PAL tool has the unique ability to create fake counters that don’t normally exist in a performance counter log, but can be analyzed, charted, and processed with thresholds exactly like normal performance counters. Unfortunately, the PAL editor does not provide a way to create a generated performance counter. It must be created by manually editing the XML code of the threshold file using a text or XML editor.
The Network Interface % Network Utilization analysis is an example of a generated counter. In this example, the values of the counters \Network Interface(*)\Bytes Total/sec and \Network Interface(*)\Current Bandwidth are put through a formula that produces a percentage value of the amount of network bandwidth used based on the amount of data passing through compared to the current bandwidth of the network interface. In the PAL report, the % Network Utilization performance counter appears as if it was a real performance counter.
The technique of creating generated counters based on other counters was also used in the SQL Server threshold file to compare full scans/sec to batch requests/sec in a ratio. Once the generated ratio counter was created, it is easy to add thresholds and chart thresholds for it.
Examine the XML code of the analyses mentioned above as examples of creating your own generated performance counters.
PAL version is incompatible
If you receive the following error, “CheckPalXmlThresholdFileVersion : The threshold file specified is not compatible with PAL v2.0”, then the threshold file is missing the PALVERSION attribute. This is a bug with the editor. Open the threshold file in an XML or text editor and add the XML attribute PALVERSION to the PAL XML node with a value of “2.0”. It should look similar to this:
<?xml version="1.0"?>
<PAL PALVERSION="2.0" NAME="Quick System Overview" …
Save the threshold file and try again. This was discussed on the PAL forum at:
https://pal.codeplex.com/discussions/468305
Conclusion
I know this guide on creating your own threshold files for PAL is very much over due, but I hope you find it useful. If you create a threshold file, then I am happy to include it in the next release of the PAL tool. Just ping me on Twitter @ClintH or post your questions on the PAL forums at https://pal.codeplex.com.
