SQL Nexus – The Tool
After writing about "How to analyse SQL Server Performance", I decided to write a post about SQL Nexus, which, if I am not mistaken, I have mentioned before in previous posts.
SQL NEXUS:
Download tool from:
https://blogs.msdn.com/khen1234/archive/2007/09/23/random-thoughts-on-my-trip-to-the-conference.aspx
This tool is great to help analyze performance issues and should go hand in hand with PSSDIAG/SQLDIAG.
To use it properly, you will need this too ;)
ReadTrace:
and this
RML Utils:
(order in which to install: RML UTILS, READTRACE and NEXUS)
By default, when you open up SQL Nexus, it asks you to connect to a SQL Server. This can be any SQL Server that will store the data Nexus needs. By default it will create a database SQLNEXUS. You can point nexus to use any database you like - and should do so if you plan to run Nexus more than once on the same server. The reason: once data is in the database, Nexus will only read and not overwrite the data.
Once this is all up and running, we select the IMPORT button down below (bottom left corner) and point to the PSSDIAG output files.
If any error occurs during import, the log file to look at is: %tmp%\sqlnexus*.log
OK - Lets say then that all your data has been imported correctly:
Let's see what SQL Nexus shows us. We have four Main options to select:
Blocking and Wait Statistics
Bottleneck Analysis
SQL 2000 Blocking
ReadTrace_Main
Realtime Server Status is information on the server you are currently running on - this may not be the SQL Server server you are pointing nexus to (if running nexus on your laptop for example).
Note: The information Nexus will show depends on the a. data collected and b. data successfully imported.
The above tabs are quite explicit (looking at their names) so I am just going to pinpoint the interesting stuff:
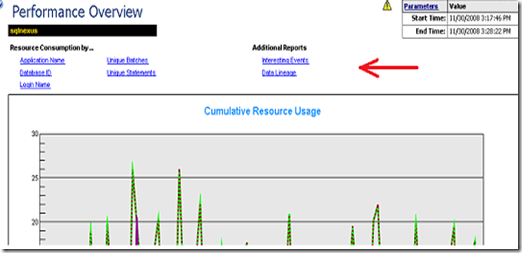
ReadTrace_Main:
In addition to all other information it shows, we have the following options that give us useful data:
Interesting Events:
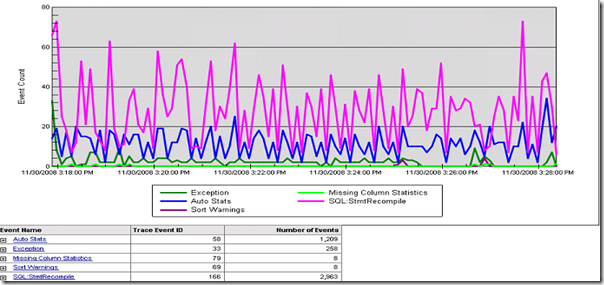
Here are get to see, as the name suggests, interesting events that occurring during the capture of the profiler trace.
An example taken from my machine:
Information on Sort and Hash warnings (indication of queries using up lots of memory to do a hash or a sort which means unoptimized queries), Exceptions, Missing Stats and other events.
The second best thing about Nexus is that it imports all the PSSDIAG data into tables, which facilitate the retrieval of data!
To help out a bit, here are some queries I use when analyzing data from Nexus:
TOP 5 Waittypes
IF OBJECT_ID ('vw_PERF_STATS_SCRIPT_RUNTIMES') IS NOT NULL
BEGIN
DECLARE @v_StartTime datetime
DECLARE @StartTime varchar(25)
DECLARE @v_EndTime datetime
DECLARE @EndTime varchar(25)
SELECT @v_StartTime = MIN (runtime) FROM vw_PERF_STATS_SCRIPT_RUNTIMES
SELECT @v_EndTime = MAX (runtime) FROM vw_PERF_STATS_SCRIPT_RUNTIMES
SET @Starttime = convert(varchar(25),@v_StartTime,121)
SET @EndTime = convert(varchar(25),@v_EndTime,121)
SET @Starttime = REPLACE(@StartTime,' ','T')
SET @EndTime = REPLACE(@EndTime,' ','T')
END
IF OBJECT_ID ('DataSet_WaitStats_WaitStatsTop5Categories') IS NOT NULL AND OBJECT_ID ('tbl_OS_WAIT_STATS') IS NOT NULL
EXEC DataSet_WaitStats_WaitStatsTop5Categories @Starttime,@Endtime
IF OBJECT_ID ('DataSet_WaitStats_BlockingChains') IS NOT NULL AND OBJECT_ID ('tbl_OS_WAIT_STATS') IS NOT NULL
EXEC DataSet_WaitStats_BlockingChains @Starttime,@Endtime
ELSE
SELECT 0 AS first_rownum, 0 AS last_rownum, 0 AS num_snapshots, GETDATE() AS blocking_start, GETDATE() AS blocking_end,
0 AS head_blocker_session_id,
'No Data' AS blocking_wait_type, 0 AS max_blocked_task_count, 0 AS max_total_wait_duration, 0 AS avg_wait_duration_ms, 0 AS max_wait_duration_ms,
0 AS max_blocking_chain_length, 0 AS head_blocker_session_id_orig, 0 AS blocking_duration_sec, GETDATE() AS example_runtime, '' AS program_name,
'' AS [host_name], '' AS nt_user_name, '' AS nt_domain, '' AS login_name, '' AS wait_type, 0 AS wait_duration_md, '' AS request_status,
'' AS wait_resource, 0 AS open_trans, '' AS transaction_isolation_level, '' AS tran_name, GETDATE() AS transaction_begin_time,
GETDATE() AS request_start_time, '' AS command, '' AS resource_description, GETDATE() AS last_request_start_time,
GETDATE() AS last_request_end_time, '' AS procname, '' AS stmt_text
Show which waittype has the most waits:
select
sum(cast(waittime as bigint)) as tot_waittime,
count(*) as tot_waiters,(sum(cast(waittime as bigint))/count(*)) as [Avg Wait Time (ms)],
waittype,
case waittype
when 0x0000 then 'MISCELLANEOUS'
when 0x0001 then 'LCK_M_SCH_S'
when 0x0002 then 'LCK_M_SCH_M'
when 0x0003 then 'LCK_M_S'
when 0x0004 then 'LCK_M_U'
when 0x0005 then 'LCK_M_X'
when 0x0006 then 'LCK_M_IS'
when 0x0007 then 'LCK_M_IU'
when 0x0008 then 'LCK_M_IX'
when 0x000D then 'LCK_M_RS_S'
when 0x000F then 'LCK_M_RIn_NL'
when 0x0015 then 'LCK_M_RX_X'
when 0x0020 then 'LATCH_NL'
when 0x0021 then 'LATCH_KP'
when 0x0022 then 'LATCH_SH'
when 0x0023 then 'LATCH_UP'
when 0x0024 then 'LATCH_EX'
when 0x0025 then 'LATCH_DT'
when 0x0030 then 'PAGELATCH_NL'
when 0x0031 then 'PAGELATCH_KP'
when 0x0032 then 'PAGELATCH_SH'
when 0x0033 then 'PAGELATCH_UP'
when 0x0034 then 'PAGELATCH_EX'
when 0x0035 then 'PAGELATCH_DT'
when 0x0040 then 'PAGEIOLATCH_NL'
when 0x0041 then 'PAGEIOLATCH_KP'
when 0x0042 then 'PAGEIOLATCH_SH'
when 0x0043 then 'PAGEIOLATCH_UP'
when 0x0044 then 'PAGEIOLATCH_EX'
when 0x0045 then 'PAGEIOLATCH_DT'
when 0x0063 then 'ASYNC_NETWORK_IO'
when 0x006D then 'OLEDB'
when 0x007F then 'LOGMGR_QUEUE'
when 0x00A2 then 'SQLTRACE_BUFFER_FLUSH'
when 0x00B1 then 'WRITELOG'
when 0x00BA then 'CXPACKET'
when 0x00BE then 'EXECSYNC'
when 0x00CE then 'TRACEWRITE'
end AS [Waittype Name]
from tbl_SYSPROCESSES
where waittype not in (0x800, 0x00a9,0x007e,0x009d,0x00ad,0x0060,0x0081,0x00bc,0x0080,0x0075)
group by waittype, lastwaittype
order by sum(cast(waittime as bigint)) desc
.. With the results of the top query... This query can be used:
--Time blocking--
select r.runtime,
coalesce (writelog, 0) as [Num WriteLog Waits],
coalesce (waittime_wl, 0) as [Total Wait time (ms)]
from (select distinct runtime from tbl_sysprocesses) r
left outer join (select runtime, count (*) writelog, sum(waittime)
waittime_wl from tbl_sysprocesses where waittype = 0x00B1 group by runtime) b
on r.runtime = b.runtime
order by runtime
--Time blocking for intent inclusive --
select r.runtime,
coalesce (LCK_M_IX, 0) as [Num LCK_M_IX Waits],
coalesce (LCK_M_IX_wl, 0) as [Total Wait time (ms)]
from (select distinct runtime from tbl_sysprocesses) r
left outer join (select runtime, count (*) LCK_M_IX, sum(waittime)
LCK_M_IX_wl from tbl_sysprocesses where waittype = 0x0008 group by runtime) b
on r.runtime = b.runtime
order by runtime
--Time Periods for Shared Blocking--
select r.runtime,
coalesce (LCK_M_S, 0) as [Num LCK_M_S Waits],
coalesce (LCK_M_S_wl, 0) as [Total Wait time (ms)]
from (select distinct runtime from tbl_sysprocesses) r
left outer join (select runtime, count (*) LCK_M_S, sum(waittime)
LCK_M_S_wl from tbl_sysprocesses where waittype = 0x0003 group by runtime) b
on r.runtime = b.runtime
order by runtime
--Time Periods for CXPacket Blocking--
select r.runtime,
coalesce (CXPacket, 0) as [Num CXPacket Waits],
coalesce (CXPacket_wl, 0) as [Total Wait time (ms)]
from (select distinct runtime from tbl_sysprocesses) r
left outer join (select runtime, count (*) CXPacket, sum(waittime)
CXPacket_wl from tbl_sysprocesses where waittype = 0x00BA group by runtime) b
on r.runtime = b.runtime
order by runtime
Note: This will pinpoint a time when the total wait time (ms) is highest. Once this is know, profiler trace can be handy to see what was being executed at that time.
Note: These queries are o help analyze performance issue
Longest Running Queries:
select *
from readtrace.tblbatches bch inner join readtrace.tblUniquebatches ubch
on bch.hashid = ubch.hashid
order by duration desc
Note: You can then change the order by to CPU / Reads / Writes - depending on what you are analyzing.

