Performance Management: Monitoring CPU Resources….
CPU Performance and Monitoring is one of the most important aspects for what we do in computing every day. End users and information workers want a performant system, the help desk doesn’t want “my machine is running slow” calls, and the IT staff has to manage power consumption to keep operating costs in check. In this post I am going to discuss how was can satisfy all three groups using some of the built in tools on our Windows Systems.
Of course we are also going to address this from a virtualization aspect as that is the direction of this series. Fortunately for us though, monitoring CPU Performance across virtualized workloads is almost identical to monitoring physical machines. We still leverage Task Manage and Performance Monitor as our primary tools. If you have a System Center Operation manager install, then you have the additional benefit of very granular monitoring, reporting and alerting features
Let’s start with the basics….
The most basic form of monitoring comes from the Task Manager. The Task Manager has seen many improvements over the years. In Windows Server 2012 and Windows 8, we now have a very detailed and robust, built-in means of monitoring many performance aspects in real time. As you can see from the screen shot below, the new Task Manager has a significantly different look to it. We now list all Applications, Windows Processes, and Background Processes and allow each item to be expanded out for more detail. In the screen shot below, you can see that we have expanded out the Internet Explorer process so that it shows each window or tab that is open. This allows us to see what CPU resources are being utilized be each open windows or tab. This is very useful for troubleshooting an web page or app that may be frozen or causing a performance on a machine.
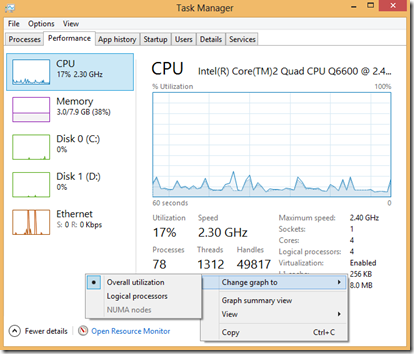
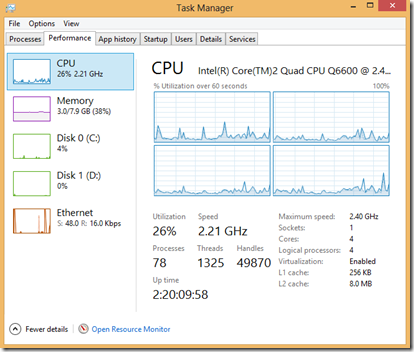
When we select the Performance tab in Task manager, we also have a new view into the big 4 items. For CPU monitoring, the default view consolidates all physical and logical CPU’s into a single CPU view. in the sample from my machine, the default view shows the cumulative performance across all CPU’s. Even though it only shows a single CPU in this view, my machine is actually a quad-processor machine. To change the view to chow all logical CPU’s, right click in the main window, and select Change graph to –> Logical Processors
Default View
Showing all Logical Processors
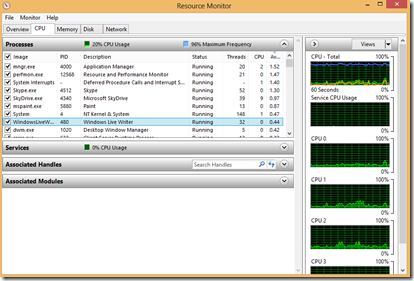
Another feature we have in the Task Manager is access to the Resource Monitor. It is the link at the bottom of the previous screen shot. When you open the Resource Monitor we cab get a detailed real time view of CPU usage across any process. You can check the box to the left of a process to add/remove it from the graphed processes on the far right hand side.
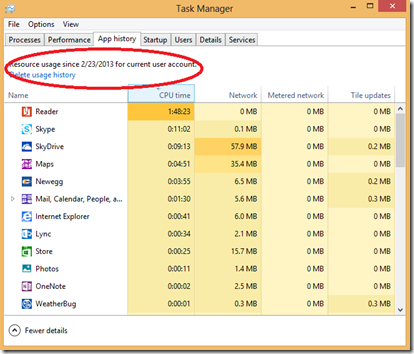
On Windows 8 client machines, here is also an App History tab where we can find historical CPU performance of the apps on our systems. This data is reflected for the previous 30 days and can manually be reset at anytime from this screen. Double-clicking an application in the list will launch that application.
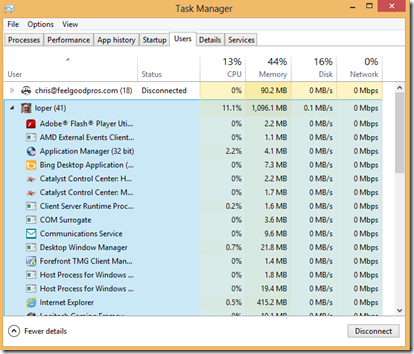
Finally, we have a Users Tab that allows us to get information about what apps and processes are consuming resources in different user sessions. Below we see my active session as well as another user that logged in but is currently disconnected.
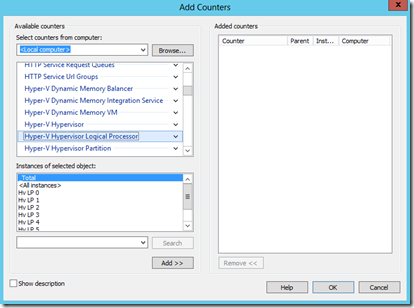
Now….if we really want to dig into CPU performance monitoring, we need to leverage Performance Monitor and the new Hyper-V counters. However, we have to be careful to select the appropriate counters. When the Hyper-V role is enabled on a Windows Server, there are a whole host of new PerfMon counters and objects that are added to allow us to monitor performance of the virtualized workloads. These can be found in PerfMon by selecting to add counters then scrolling to the “Hyper-V” section where you will see a large number of new Hyper-V related counters. What you choose to monitor will depend on what information you are trying to retrieve.
Processor:
Once you have an idea of the overall system capabilities and configuration though the “Hyper-V Hypervisor” counter set you will want to monitor the processors on the system. The most important counter set to monitor is the “Hyper-V Hypervisor Logical Processor” . This counter set allows you to determine how much of the physical processor are being used. The virtual processor counter sets only show a slice of the “Hyper-V Hypervisor Logical Processor”.
- Hyper-V Hypervisor Logical Processor
- Hyper-V Hypervisor Root Virtual Processor
- Hyper-V Hypervisor Virtual Processor
The Hyper-V Hypervisor Logical Processor - The most useful counters in this counter set are the following;
- %Guest Run
- %Hypervisor Run Time
- %Idle Run Time
- %Total Run Time
There is one logical processor that that carries more load than the rest and that is LP0. This LP is where all interrupts in the system are directed and if there is too much load you can see this LP hit 100% which likely means IO is a bottleneck in the system.
The “Hyper-V Hypervisor Root Virtual Processor” and “Hyper-V Hypervisor Virtual Processor” are just slices of the LP counter and can help you understand how much total CPU the root and guests are using on the system. There are real no limits one should expect for these counters however I generally expect to see the “% Hypervisor Time” be below 25%. Any higher and this could indicate you are not running with integration services installed. You should always make sure you have Integration Services installed for the best performance.
You should also monitor the “Processor” counter set. This counter set is only for the root CPU and does suffer from skew as detailed here - https://blogs.msdn.com/tvoellm/archive/2008/03/20/hyper-v-clocks-lie.aspx. Even with the skew this counter set is useful because it gives you an idea of how busy the root is. Remember the root is involved in all IO. This means that when the root CPU’s are saturated your whole system is likely saturated. In general you want to see the root CPU lower than 10% utilization and over 50% might indicate an issue.
Over all, the counters you will be interested in for CPU monitoring are -
Hyper-V Hypervisor Logical Processor – This one lets us select stats for each logical processor available to Hyper-V.
· %Guest Run Time – This is the percentage of time guest code is running on an LP or for the _Total the average percentage across all LP. For example if you have 2LP and one VM running CPU tests you might see the value be 95% for LP(0), 0% for LP(1) and 47.5% for the _Total. For this you can see you VM is running on LP(0).
· %Hypervisor Run Time – This is the percentage of time the Hypervisor is running on an LP or for _Total the average percentage across all LP. This is similar to % Kernel Run Time in the Processor counter set.
· %Idle Run Time – This is the percentage of time the LP is waiting for work for _Total the average percentage across all LP. This is similar to % Kernel Run Time in the Processor counter set.
· %Total Run Time – This is a sum of %Guest Run Time + % Hypervisor Runtime.
· %C1 Time – C1 is a power saving mode in a CPU. This counter keeps track of how often the process is able to enter a power saving state when idle. So %C1 Time is the percentage of time the LP is in the C1 state and for _Total the average percentage across all LP. If you want to know more about C state and other power modes in windows check out - Processor Power Management in Windows Vista and Windows Server 2008
· %C2 Time – Similar to %C1 Time. C2 is a deeper power state than C1.
· %C3 Time – Similar to %C1 Time. C3 is a deeper power state than C2.
· C1 Transitions / Sec – The is the number of times the LP has entered the C1 state in one second or for _Total the number of C1 transitions across all LP.
· C2 Transitions / Sec – Similar to C1 Transitions / Sec. C2 is a deeper power state than C1.
· C3 Transitions / Sec – Similar to C1 Transitions / Sec. C3 is a deeper power state than C2.
· Hardware Interrupts / Sec – Number of hardware interrupts per second the LP is processing. _Total is the total for all LP. Hardware interrupts are delivered to the root VP’s corresponding the LP on which it was received. For example a network card will create and interrupt when a packet is received.
· Total interrupts / sec – Total number of interrupts of all kinds the LP is processing. For _Total this is the total number of interrupts happening on the system per second.
· Monitor Transition Cost – This is a measure of the cost to enter the Hypervisor via an Intercept on a Logical Processor (LP). For _Total it is the total cost across all processors. Intercepts are like User mode to Kernel Mode context switches except here is User/Kernel Mode to Virtual Machine Monitor (VMM) aka Hypervisor mode. The smaller this value the better. The only real use it has is to figure out the relative performance of processors.
· Context Switches / sec – These are the number of times a new Virtual Processor (VP) had been scheduled to a particular Logical Processor (LP). For _Total it is the total number of VP to LP switches. Ideal time context switches of around 1000 for a single guest running are not uncommon. This is due to the fact the VP will “Halt” and allow something else to run if it has no work to do.
· Scheduler Interrupts / sec – These interrupts are sent by the Hypervisor scheduler from one Logical Processor (LP) to another to reevaluate their runlist. The runlist is the list of Virtual Processors (VP) waiting to run on a given LP. This is also a “wake-up” mechanism for an LP that might be sitting idle in a lower power state. _Total is the total number of scheduler interrupts happen per second across all LPs.
· Inter-processor interrupts sent /sec – These interrupts are from one processor to another to get the processor to do memory coherency (like TLB, cache, …). High counts > 20ish per Logical Processor (LP) can indicate lots of guest pages modification (like page access). _Total is the total number of Inter-processor interrupts (IPIs) set per second.
· Inter-processor interrupts /sec – This counters is the total number of Inter-processor interrupts (IPI)received per second of a give Logical Processor (LP). _Total is the total number of IPI’s received by all LP.
· Timer interrupts / sec – There are a number of timers that the Hypervisor supports – APIC timer, PM Timer, … This is the number of times an LP is interrupted to service a timer interrupt. )
Hyper-V Hypervisor Root Virtual Processor – Details on what the root Virtual Processors. There is one root VP for every Logical Processor. You can think of a logical processor as similar to a core on a physical processor.
· %Guest Run Time – For guest VM’s this is the percentage of time the guest VP is running in non-hypervisor code on an LP or for the _Total the total across all guest VP’s. For the root this is the percentage of time the root VP is running in non-hypervisor code on an LP or for _Total the total across all root VP’s. If you sum the _Total for both the guest VP’s and root VP’s this will equal the % Guest Run Time _Total of the Logical Processor counter set.
· %Hypervisor Run Time – For guest VM’s this is the percentage of time the guest VP is running in hypervisor code on an LP or for the _Total the total across all guest VP’s. For the root this is the percentage of time the root VP is running in hypervisor code on an LP or for _Total the total across all root VP’s. If you sum the _Total for both the guest VP’s and root VP’s this will equal the % Hypervisor Run Time _Total of the Logical Processor counter set.
· %Total Run Time – This is just a sum of %Guest Run Time + % Hypervisor Runtime on a per VP basis. If you sum the %Total Run Time across the Root Virtual Processor and Virtual Processor counter sets it will equal the sum of %Total Run Time from all the Logical Processor counters.
· Total Intercepts/sec – Whenever a guest VP needs to exit is current mode of running for servicing in the hypervisor this is called an intercept. Some common causes of intercepts are resolving Guest Physical Address (GPA) to Server Physics Address (SPA) translations, privileged instructions like hlt / cupid / in / out, and the end of the VP’s scheduled time slice.
· Total Intercepts Cost – This is a relative measure of cost of intercepts. The cost can vary based on the types of intercepts and the machine architecture.
· Hypercalls/sec – Hypercalls are one form of enlightenment. Guest OS’s use the enlightenments to more efficiently use the system via the hypervisor. TLB flush is an example hypercall. If this value is zero and says zero this is an indication that Integration Components are not installed. New OS’s like WS08 can use hypercalls without enlightened drivers so it is only a prereq. not a guarantee of having Integration Components installed.
· Hypercalls Cost – This is a relative measure of cost of hypercalls. The cost can vary based on the types of calls and the machine architecture.
· HLT Instructions/sec – Number of CPU halts per second on the VP. A HLT will cause the hypervisor scheduler to de-schedule the current VP and move to the next VP in the runlist.
· HLT Instructions Cost - This is a relative measure of cost of halt. The cost can vary based on the machine architecture.
· IO Instructions/sec – Number of CPU in / out instructions executed per second. Many older or low bandwidth devices use “programmed I/O” via in / out instructions.
· IO Instructions Cost - This is a relative measure of cost of the in / out instructions. The cost can vary based on the machine architecture.
· Page Fault Intercepts/sec – Whenever guest code accesses a page not in the CPU TLB a page fault will occur. This counter is the number of Page Faults per second. This counter is closely correlated with the Large Page TLB Fills /sec Small Page TLB Fills / sec counters.
· Page Fault Intercepts Cost - This is a relative measure of cost of a page fault. The cost can vary based on the machine architecture.
· Large Page TLB Fills/sec – There are two types of TLB entries (and some three). Small TLB which generally means a 4K page and Large Page which generally means 2MB. There are fewer Large TLB entries on the order of 8 – 32. This counter is the number of Large Page TLB fills / second. A non-zero value indicates the guest OS is using large pages.
· Small Page TLB Fills/sec – There are two types of TLB entries (and some three). Small TLB which generally means a 4K page and Large Page which generally means 2MB. There are fewer Large TLB entries on the order of 64 – 1024+. This counter is the number of Small Page TLB fills / second.
· Emulated Instructions/sec – Some instructions require emulation to complete in the Hypervisor. One such example is APIC access. This counter is the number of emulated instruction completed per second.
· Emulated Instructions Cost - This is a relative measure of cost of emulation. The cost can vary based on the machine architecture.
· CPUID Instructions/sec – The CPUID instruction is used to retrieve information on the local CPU’s capabilities. This counter is the number of CPUID instructions calls per second. Typically CPUID is only called when the OS / Application first start so this value most likely will be 0 most of the time.
· CPUID Instructions Cost - This is a relative measure of cost of the CPUID instruction. The cost can vary based on the machine architecture.
· MSR Accesses/sec – Machine specific register instruction calls per second. There are many types of MSRs such as C-state config, Synthetic Interrupt (Synic) Timers, and control functions such as shutdown.
· MSR Accesses Cost - This is a relative measure of cost of the MSR instruction. The cost can vary based on the machine architecture.
· Control Register Accesses/sec – Number of CPU Control Register accesses per second. Control registers are used to set up address mapping, privilege mode, etc.
· Control Register Accesses Cost - This is a relative measure of cost of changing the control register. The cost can vary based on the machine architecture.
· MWAIT Instructions/sec – Number of MWAIT Instructions per second. MWAIT is the monitored wait instruction where the CPU waits for a memory location between a and b to change.
· MWAIT Instructions Cost - This is a relative measure of cost of the MWAIT instruction. The cost can vary based on the machine architecture
Hyper-V Hypervisor Virtual processor - This allows us to retrieve stats on logical processors assigned to individual running VM instances
Resources:
Processor Power Management for Windows 7 and Windows Server 2008 R2
View CPU Utilization and other Performance Information
MSDN Blogs – Monitoring Hyper-V Performance
-Cheers!

