Monitoring Dynamic Memory in Windows Server Hyper-V 2012….
Question – How do you determine how much memory to assign to a virtual machine?
Real Answers from Administrators -
“We add up the recommended memory on the box for all the apps that will run then assign that to the VM”
“We add up the recommended memory on the box for all the apps that will run, add 25%, then assign that to the VM”
“Every VM gets <insert number here> gigs of RAM. We don’t change it unless someone complains”
“We only virtualize Exchange….so it gets all of the available RAM”
I have asked this question many times since the introduction of Dynamic Memory several years ago. I almost never hear the following -
“We use Operations Manager or Performance Monitor to track usage over time, establish a baseline, then adjust the memory of the VM. We then continue to monitor over time to see if there are trends that warrant adjustments.”
I know that is exactly what IT Pros do though. Because you are Pros. But maybe you are new to Windows, new to the IT field, or just trying to correct some bad behavior in your department. For those scenarios, I want to give you the tools you need to do things the right way.
---------------
With the release of Windows Server 2008 R2 SP1, Microsoft introduced a new feature called Dynamic Memory for Hyper-V hosts. Prior to this feature being introduced, all guest virtual machines were give a static assignment for memory. To change the memory allocation required administrators to shut down the guest VM, change the memory assignment, then restart the VM. This of course is inefficient and requires downtime.
Dynamic Memory allows Hyper-V administrators to assign a dynamic allocation of memory to a VM that draws from a pool of memory on the host. The goal of Dynamic Memory is to optimize memory utilization without sacrificing performance. This also opens the door to greater virtual machine density per host which allows for a lower TCO.
In this post we will walk through the options for Dynamic Memory and investigate how we can further optimize memory using monitoring. Let’s lay the groundwork….
Hyper-V Host Requirements -
Windows Server 2008 R2 + SP1 (or later) or Windows Server 2012
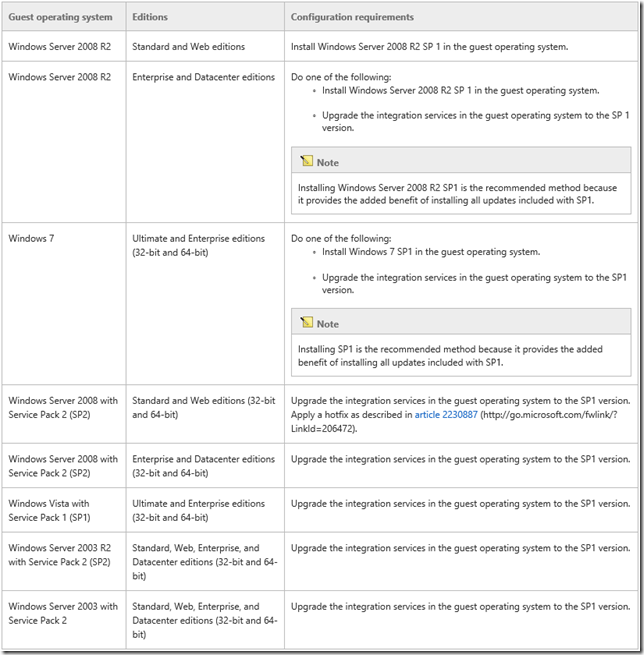
Guest VM Requirements – See Chart Below
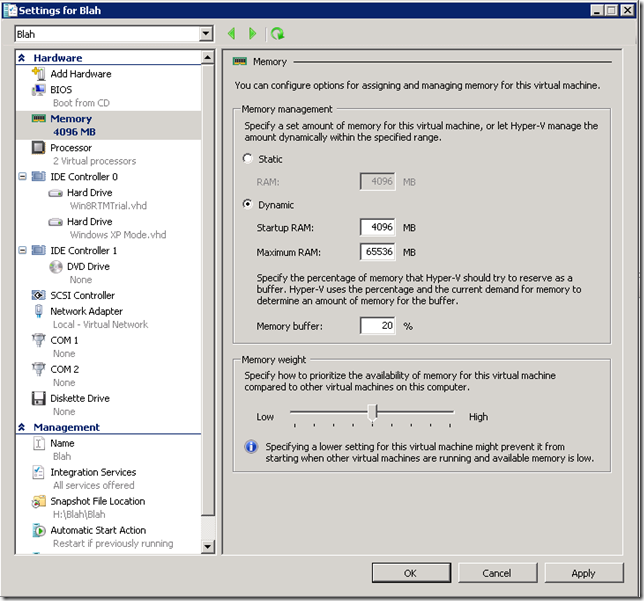
There are no global configuration for Dynamic memory at the Hyper-V host level. All of the settings are managed on a per VM basis. Once you have created a virtual machine, you can look at the settings of the VM and see the Dynamic Memory options. However, there are some subtle differences in the options between versions of Hyper-V. Let’s do Windows Server 2008 R2 + SP1 first.
Windows Server 2008 R2 + SP1 Hyper-V (below)
Note that we can still specify a Static amount of memory for a VM. Dynamic memory is not a requirement. We can also have a mix of static and dynamic memory VM’s on the same host.
When we enable Dynamic memory we get some additional options -
Startup RAM – The amount of memory required to start the virtual machine. There needs to be enough here to allow the VM to start up. But you don’t want to over-allocate because the memory will be wasted and reduce the total number of VM’s you can run on the host.
Maximum RAM – The maximum amount a RAM a VM can request and be assigned. Can be a low as the Startup RAM value or up to a max of 64GB or the max of what the Guest VM O/S Supports. (ie, 4GB for a 32 bit Windows 7 Guest)
Memory Buffer – Specifies how much memory Hyper-V will attempt to assign to the virtual machine compared to the amount of memory actually needed by the applications and services running inside the virtual machine. Not to exceed the Maximum RAM amount.
Memory Weight – Tell Hyper-V which VM’s have a higher or lower priority for dynamic memory allocations.
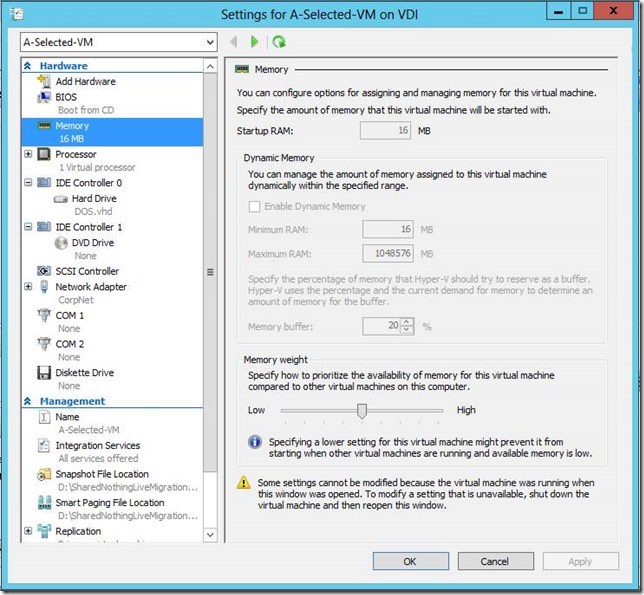
The settings used in Windows Server 2012 are a tad bit different.
Windows Server 2012 Hyper-V (below)
Startup RAM – Serves double duty in Windows Server 2012 Hyper-V
1) If Dynamic Memory is NOT enabled, Startup RAM acts as the “Static” memory value
2) If Dynamic Memory IS enabled, it represents the amount of memory required to start the virtual machine. (same as Windows 2008 R2 + SP1)
Minimum RAM – *NEW* This is the minimum amount of RAM that must be assigned to the VM at all times. This number must be less than or equal to the Startup RAM value. It effectively lets Hyper-V reduce the amount of memory assigned to the VM if it requires less and another VM requests more.
Maximum RAM – The maximum amount a RAM a VM can request and be assigned. Can be a low as the Startup RAM value or up to a max of 64GB or the max of what the Guest VM O/S Supports. (ie, 4GB for a 32 bit Windows 7 Guest)
Memory Buffer – Specifies how much memory Hyper-V will attempt to assign to the virtual machine compared to the amount of memory actually needed by the applications and services running inside the virtual machine. Not to exceed the Maximum RAM amount.
Memory Weight – Tell Hyper-V which VM’s have a higher or lower priority for dynamic memory allocations.
Windows Server 2012 Hyper-V also introduces a feature called Smart Paging. Prior to Windows Server 2012, if you attempt to start a guest VM when all available memory is assigned to other VM’s, you receive an error message and the VM fails to start. With Smart Paging, we allow the VM to start using a page file on a hard drive as virtual memory. This allows the VM to start up and for Hyper-V to manage memory allocations. There is a significant reduction in performance because hard disk paging operations take much greater time then RAM paging operations, but it does allow for the VM to start. After it comes up, Hyper-V will begin re-allocating memory to reduce the usage of the Smart Paging feature.
There is no GUI configuration for Smart Paging other than where to place the Smart Paging file location. This should be a low I/O spindle to reduce the impact of paging operations as much as possible.
Now What?
Note – For the remainder of this article, I will be using Windows Server 2012 Hyper-V/Dynamic Memory. The concepts apply to Window Server 2008 R2, but the location of the information on screen is different.
Now that you are familiar with the settings, how do we determine how much memory to allocate to a VM then monitor it over time? For the initial configuration of memory, you will just have to use your own best judgment for the values based on the workloads you are running. A good baseline to start with is to consider what you would run in a physical implementation then measure that out for a virtual. if you are running an Exchange Server role with 16 GB of memory on a physical machine, use that 16 GB value as the initial Maximum RAM entry. The Minimum RAM could be the amount of RAM recommended for running Windows Server + Microsoft Exchange. The memory Buffer can be left at 20% for now and the Memory Weight should be adjusted based on the priority you specify for your server roles.
Once this has been configured, you can monitor ongoing performance and changes in two different ways -
Monitoring Virtual Memory in Real Time –
Using the Hyper-V MMC, you will see that we display some information about memory in real time -
Assigned Memory – This is how much memory is allocated to the Guest VM at this time.
When you select a VM, you will also have an info pane below the list of VM’s with more specific information about memory for the selected VM -
Memory Demand – Derived from performance counters, this is the amount of memory required at this time to fulfill the requirements of what is going on in the running VM.
Memory Status – There are only 3 things that will display here -
OK – Hyper-V has enough memory to provide a full memory buffer to the selected VM
Low – Hyper-V is reporting that it does not have enough memory to satisfy the memory buffer in full
What this really means - Generally not a critical issue. Some attention should be paid to how much memory is allocated across all guest VM’s and possible changes made to adjust for proper buffer allocations.
Warning – Hyper-V is reporting that it does not have any available memory to dedicate to the memory buffer
What this really means – There isn’t enough memory to allocate to the memory buffer. This means that you will possibly end up using Smart Paging and thus take a performance hit, or, based on Weight, you may starve another lower priority machine of memory. You should evaluate how much memory is allocated across all VM’s and adjust accordingly. The only solution may be to migrate some of the VM’s to a different Hyper-V server or add more physical RAM to the Host Hyper-V server.
Monitoring Virtual Memory with Performance Counters -
Dynamic Memory has a collection of Performance Monitor Counters and Objects for digging deep into what is really going on with memory allocations.
The Memory Balancer is the process that handles allocation of memory to the guest VM’s. It relies on other performance counters information to determine when, where, and how much memory to move around at any given time.
Available Memory – Exactly that, how much memory we have available right now.
Average Pressure – Pressure is synonymous with availability. This is a calculation of how much memory the VM wants divided by the amount of memory the VM currently has and then multiplied by 100 [ie; (Mem Wanted/Mem allocated)*100 ] Average pressure at this level is the average pressure of all VM’s at any given time. As long as this number stays under 100, you have enough available memory to service all virtual machines. If you go over 100, then you have VM’s that are doing paging operations with the VM itself and you will see performance degradation. For best performance with less risk of paging operations, this number should consistently be below 100 with no spikes above. Ideally around 80, though highly tuned systems that are very dense may run higher.
These counters allows you to choose individual VM instance objects by name as they appear in the Hyper-V Manager.
Average Pressure – Same as above but for a specific VM
Current Pressure – This is the current available memory for a VM instance
Guest Visible Physical Memory – The amount of memory visible within a VM instance
Maximum Pressure – Maximum memory available to the VM instance
Minimum Pressure – Minimum memory available to the VM instance
Physical Memory – Current amount of memory in the VM instance
Smart Paging Working Set – The size of the Smart Paging Working Set for a VM Instance
---------------
Of all the counters listed here, the ones you will likely spend the most time monitoring are -
Hyper-V Dynamic Memory Balancer –> Average Pressure – This will allow you to see what the average available memory is at the host level over a period of time. This is great for establishing a baseline and continued monitoring over time to determine if workloads need to be shifted or more memory should be added to the host.
Hyper-V Dynamic Memory VM –> Average Pressure, Maximum Pressure, Minimum Pressure – These will allow you to look at the memory performance of individual VM instances. Again to establish a baseline as well as ongoing monitoring for future optimizations.
To monitor this with performance Monitor, you can make a Collector Set
To create a Data Collector Set to monitor memory allocation
- Start Performance Monitor and add one or more of the new performance counters.
- Click Start, right-click Computer, and click Manage. In the Microsoft Management Console navigation tree, click Reliability and Performance.
- In the navigation tree, expand Reliability and Performance, expand Monitoring Tools, and click Performance Monitor.
- In the menu bar above the Performance Monitor graph display, either click the Add button ( + ) or right-click anywhere in the graph and click Add counters from the menu. The Add Counters dialog box opens.
- In the Available Counters section, scroll through the list to find Hyper-V Dynamic Memory VM and then click the plus (+) sign to expand the group. Select one or more counters from this group.
- On the left hand side, right click on Performance Monitor, point to New, and click Data Collector Set. The Create New Data Collector Set Wizard starts. The Data Collector Set created will contain all of the data collectors selected in the current Performance Monitor view.
- Type a name for your Data Collector Set and click Next.
- The Root Directory will contain data collected by the Data Collector Set. Change this setting if you want to store your Data Collector Set data in a different location than the default. Browse to and select the directory, or type the directory name.
- Note: If you enter the directory name manually, you must not enter a back slash at the end of the directory name.
- Click Next to define a user for the Data Collector Set to run as, or click Finish to save the current settings and exit.
You now have a Data Collector Set that you can run in the background to collect performance data for the Hyper-V Counters and Objects you have selected. This will let you establish baselines, monitor ongoing performance of the Hyper-V Host as well as the VM’s and ultimately give you the answer to “How much memory should I assign to a virtual machine?”. Additionally, you can use this data to increase the density of VM’s on a per host basis without compromising on performance. This leads to more VM’s per host which hopefully means fewer hosts needed and ultimately a lower TCO across the board.
References and Additional Resources -
Hyper-V Dynamic Memory Configuration Guide (2008 R2)
Hyper-V Dynamic Memory Overview
Tracking Hyper-V Dynamic Memory (So Many Questions. So Little Time. Part 6.)
Looking at Dynamic Memory Performance Counters
A Guide to Hyper-V Dynamic Memory – Aidan Finn
Looking at Dynamic Memory Performance Counters
Cheers!


![clip_image002[5] clip_image002[5]](https://msdntnarchive.blob.core.windows.net/media/TNBlogsFS/prod.evol.blogs.technet.com/CommunityServer.Blogs.Components.WeblogFiles/00/00/00/54/27/metablogapi/4812.clip_image0025_thumb_095697BC.jpg)
![clip_image002[7] clip_image002[7]](https://msdntnarchive.blob.core.windows.net/media/TNBlogsFS/prod.evol.blogs.technet.com/CommunityServer.Blogs.Components.WeblogFiles/00/00/00/54/27/metablogapi/8168.clip_image0027_thumb_68D1E8BA.jpg)
![clip_image002[9] clip_image002[9]](https://msdntnarchive.blob.core.windows.net/media/TNBlogsFS/prod.evol.blogs.technet.com/CommunityServer.Blogs.Components.WeblogFiles/00/00/00/54/27/metablogapi/7610.clip_image0029_thumb_188F913A.jpg)
![clip_image002[13] clip_image002[13]](https://msdntnarchive.blob.core.windows.net/media/TNBlogsFS/prod.evol.blogs.technet.com/CommunityServer.Blogs.Components.WeblogFiles/00/00/00/54/27/metablogapi/8130.clip_image00213_thumb_2CA8ADC3.jpg)