Cheat Sheet: Break into a Windows machine with a debugger
Short version - there steps:
1. Enable debugging on the Windows guest machine.
2. Change the VM settings to support debugging via named pipe.
3. Configure your debugger and break in.
Longer Version:
1. Enable debugging on the Windows guest machine.
This assumes you have a Windows virtual machine already built and running. You also need administrative privileges and a reboot will be required.
Open an administrative command prompt and type:
bcdedit /set debug on
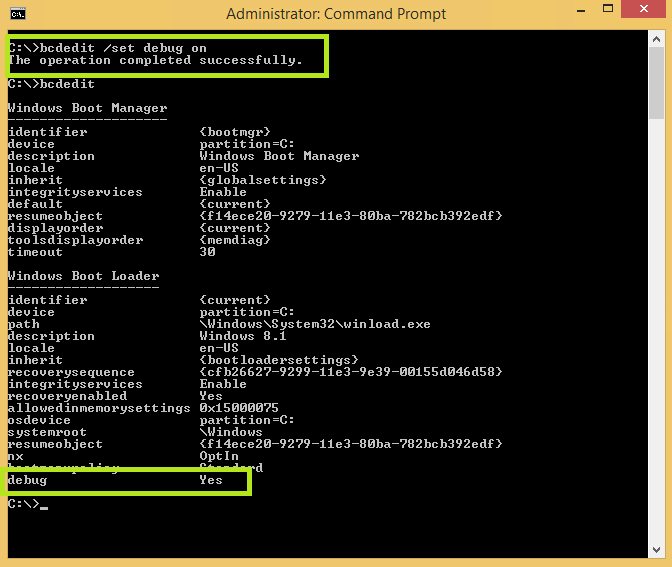
If you want to check - type bcdedit on its own and you should see debug - Yes.
Reboot the machine.
2. Change the VM settings to support debugging via named pipe.
Open the HYPER-V Console and find the machine you wish to debug. (Similar process for other VM platforms).
Open the virtual machine settings and find the COM settings.
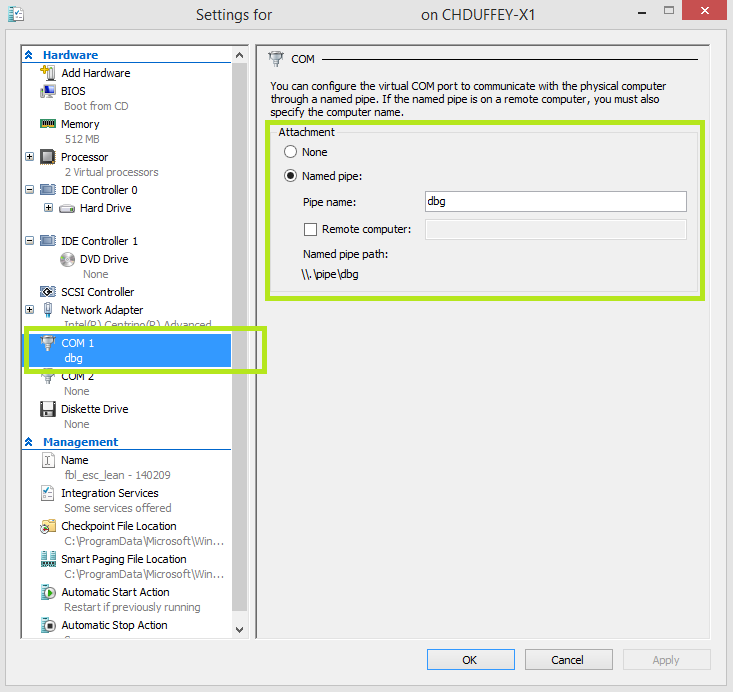
Choose the option for a "named pipe".
It doesn't matter too much what you call the pipe, once you type something it will tell give you a path to the pipe which you can use in your debugger. This will be important for step 3.
In my example: \\.\pipe\dbg
3. Configure your debugger and break in.
You need to install a debugger. I find windbg useful for what i do, but the choice is yours. It has a next > next > next style install so i wont waste your time here. Once it is installed we are ready to roll.
Open the debugger elevated so that you can get access to the guest machine running on the host.
Choose File > Kernel Debug and locate the tab that says COM
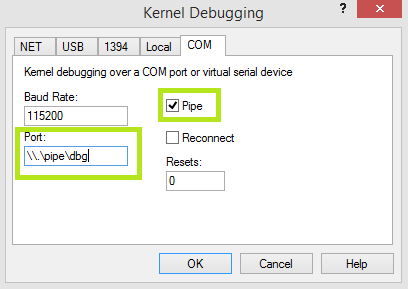
This is where you type the path that the virtual machine COM settings gave you. In my example it was \\.\pipe\dbg
When you hit ok, the debug will attempt to attach to your virtual machine.
If you get an error - check that you used an elevated version of the windbg process and check the Port (pipe) path. Also make sure you ticked "pipe" in the debugger like the image above.
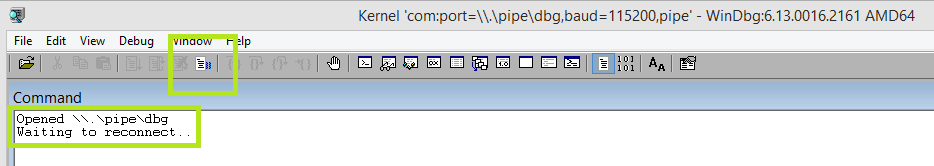
At this point, the machine is ready for you to break in. If you hit the icon with the blue squiggly lines (shown above) you take control of the machine and can start to mess around with the debugger. Remember, the machine will appear "frozen" while you are broken in because you are controlling the machine and stepping through instructions. If you want to let it proceed, just type 'g' for Go in the debugger.
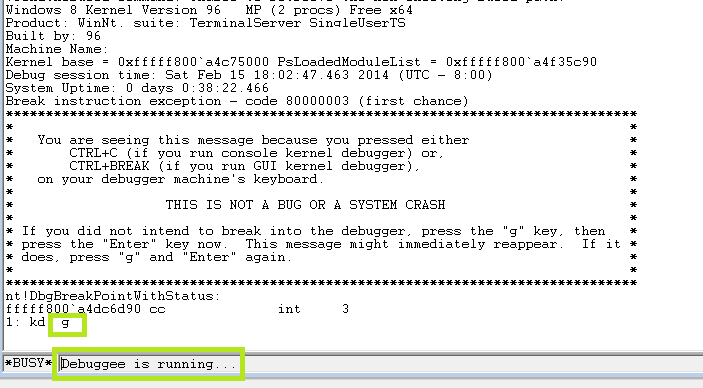
If you want to break in again, just hit the break icon as before (or type ctrl-break)
Thanks,
Chad