Audit All GPO’s for Deny User Right Assignments in an AD forest.
In large delegated Active Directory environments, one of the things I hear often is if I follow the Microsoft recommendations on creating a GPO to deny Enterprise Admin and Domain Admin rights to access “Tier 1” or “Tier 2” computers. How do I know if I am overwriting a GPO that may already contain settings for other groups or accounts.
Guidance for Setting Deny User Rights on privileged groups:
Mitigating Pass-the-Hash (PtH) Attacks and Other Credential Theft, Version 1 and 2
Securing Enterprise Admins Groups in Active Directory
Securing Domain Admins Groups in Active Directory
Use this PowerShell to go out and perform this audit against all the GPO’s in the forest.
$default_log = $env:userprofile + '\Documents\report_gpo_deny_rights.csv' $denyuserrights = "SeDenyBatchLogonRight","SeDenyInteractiveLogonRight","SeDenyNetworkLogonRight","SeDenyRemoteInteractiveLogonRight","SeDenyServiceLogonRight" Foreach($domain in (get-adforest).domains){ foreach ($GPO in (get-gpo -ALL -Domain $domain).displayname) { [xml]$report = Get-GPOReport -Name $GPO -ReportType Xml -Domain $domain -ErrorAction SilentlyContinue foreach($userright in ($report.GPO.Computer.extensiondata.extension.UserRightsAssignment)){ foreach($right in $denyuserrights){ if($userright.Name -eq $right){ foreach($member in ($userright.member)){ $objtmp = new-object -type psobject $objtmp | Add-Member -MemberType NoteProperty -Name "Domain" -Value $domain $objtmp | Add-Member -MemberType NoteProperty -Name "GPO" -Value $GPO $objtmp | Add-Member -MemberType NoteProperty -Name "UserRight" -Value $userright.Name $objtmp | Add-Member -MemberType NoteProperty -Name "Account" -Value $member.name.'#text' $objtmp | export-csv $default_log -append -NoTypeInformation } } } } }} |
Open the results in notepad
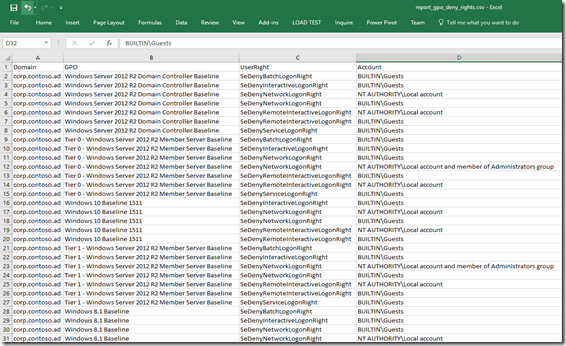
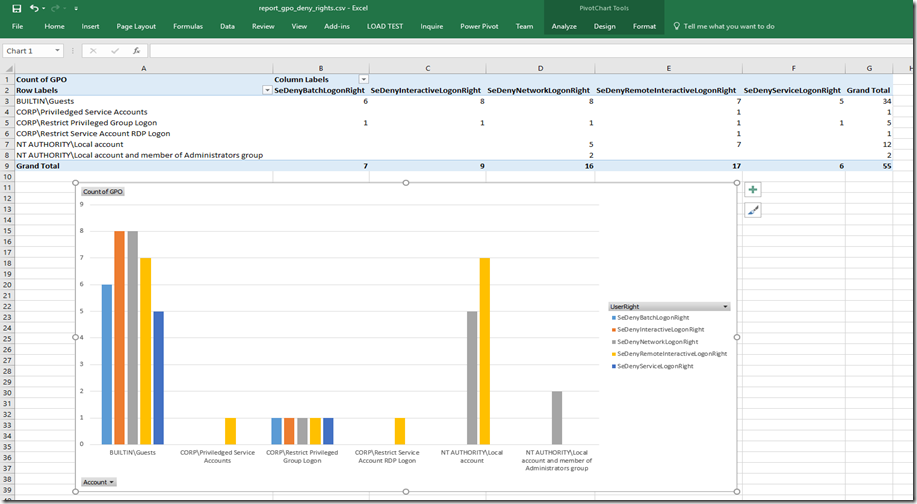
Open the results in excel (2016)
One theme you are going to see from my blogs is leveraging Power BI from within Excel to display data differently.
1. Make sure excel has powerpivot enabled.
2. Select Insert, Power Chart, and Pivot Chart
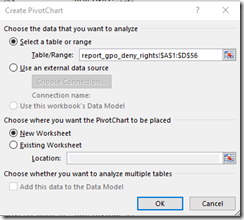
3. Select OK, (Table/Range should auto select the correct content, and new worksheet)
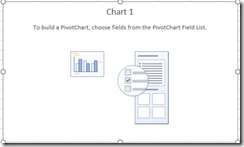
4. Select Chart 1
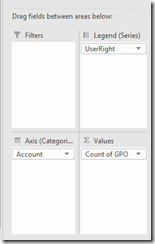
5. Under the Pivot Charts Field , drag the fields to the area to match what I have.
6. You should now have a nice graph, make sure to save the file to an excel format.
Looking back at this I may do an update to include what OU the gpo’s are linked to. But until then I hope this is useful.
-Chad

