UNIX/Linux Log File Monitor Alert Description Tips
Hello! I recently had the opportunity of working with a customer who had a pretty simple ask about log file monitoring. When using the UNIX/Linux Log File Monitor Management Pack template, how do we include more than just one line that matched, and include all lines that matched since the last interval?
This is a really good question, and something you might expect out of the box. There is however some unfavorable behavior with the underlying data source when expecting more than one matching result. In this post I’ll discuss what causes the default behavior of only including one line, and how we can expand that to include additional data that may have matched our log file monitor (er rule).
First a few assumptions. This addresses rules that have been created using the UNIX/Linux Log File Monitoring management pack template in System Center 2012 R2 Operations Manager, and the configuration in the rule the template creates has not been modified. For reference the default configuration will look something like:
<Configuration>
<Host>$Target/Property[Type="Unix!Microsoft.Unix.Computer"]/PrincipalName$</Host>
<LogFile>/var/log/messages</LogFile>
<UserName>$RunAs[Name="Unix!Microsoft.Unix.ActionAccount"]/UserName$</UserName>
<Password>$RunAs[Name="Unix!Microsoft.Unix.ActionAccount"]/Password$</Password>
<RegExpFilter>error 1337</RegExpFilter>
<IndividualAlerts>false</IndividualAlerts>
</Configuration>
And the default alert description will look like:
$Data/EventDescription$
To find those settings, select the Authoring->Management Pack Objects->Rules view, and scope it to UNIX/Linux Computer in the UNIX/Linux Core Library. The LogFile Template rules should show here and be disabled by default (overrides exist to enable to the computer or group specified in the template configuration). Look at the properties of the rule, and under the Configuration tab there are two sections to note. The first contains the Data Source, named something similar to “Log File VarPriv Datasource”. This configures the settings for the UNIX/Linux log file module. The second is the Response, which will contain one named GenerateAlert. This configures the alert settings just as any other console-authored rule or monitor.
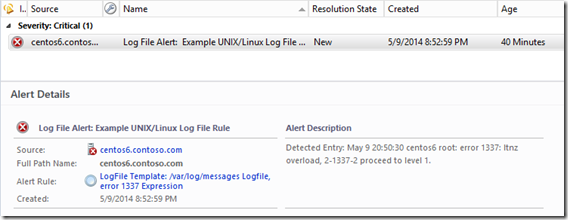
I mentioned before about some possible unfavorable behavior with the data source, but what does that necessarily mean? In the case of the ask, the alert description contains only one matching line. That’s because the data source feeds the output of the log module to an event mapper. I assume that is done to bring uniformity to the way Windows events and UNIX logs could potentially be stored and reported against, but by using the log file monitoring template, there are no responses for saving the data in the OperationsManager DB or DW as event data present by default. Below is the data source for reference, this was taken from the UNIX/Linux Core Library MP version 7.5.1019.0. I’ve highlighted the cause of the description only containing one line.
<DataSourceModuleType ID="Microsoft.Unix.SCXLog.VarPriv.DataSource" Accessibility="Public" Batching="true">
<Configuration>
<xsd:element name="Host" type="xsd:string" xmlns:xsd="https://www.w3.org/2001/XMLSchema" />
<xsd:element name="LogFile" type="xsd:string" xmlns:xsd="https://www.w3.org/2001/XMLSchema" />
<xsd:element name="UserName" type="xsd:string" xmlns:xsd="https://www.w3.org/2001/XMLSchema" />
<xsd:element name="Password" type="xsd:string" xmlns:xsd="https://www.w3.org/2001/XMLSchema" />
<xsd:element name="RegExpFilter" type="xsd:string" minOccurs="0" xmlns:xsd="https://www.w3.org/2001/XMLSchema" />
<xsd:element name="IndividualAlerts" type="xsd:boolean" minOccurs="0" xmlns:xsd="https://www.w3.org/2001/XMLSchema" />
</Configuration>
<OverrideableParameters>
<OverrideableParameter ID="Host" Selector="$Config/Host$" ParameterType="string" />
<OverrideableParameter ID="LogFile" Selector="$Config/LogFile$" ParameterType="string" />
<OverrideableParameter ID="RegExpFilter" Selector="$Config/RegExpFilter$" ParameterType="string" />
<OverrideableParameter ID="IndividualAlerts" Selector="$Config/IndividualAlerts$" ParameterType="bool" />
</OverrideableParameters>
<ModuleImplementation Isolation="Any">
<Composite>
<MemberModules>
<DataSource ID="DS" TypeID="Microsoft.Unix.SCXLog.Native.DataSource">
<Protocol>https</Protocol>
<Host>$Config/Host$</Host>
<UserName>$Config/UserName$</UserName>
<Password>$Config/Password$</Password>
<LogFile>$Config/LogFile$</LogFile>
<RegExpFilter>$Config/RegExpFilter$</RegExpFilter>
<IndividualAlerts>$Config/IndividualAlerts$</IndividualAlerts>
<QId>$Target/ManagementGroup/Name$</QId>
<IntervalSeconds>300</IntervalSeconds>
<SkipCACheck>false</SkipCACheck>
<SkipCNCheck>false</SkipCNCheck>
</DataSource>
<ConditionDetection ID="Mapper" TypeID="System!System.Event.GenericDataMapper">
<EventOriginId>$Target/Id$</EventOriginId>
<PublisherId>$MPElement$</PublisherId>
<PublisherName>WSManEventProvider</PublisherName>
<Channel>WSManEventProvider</Channel>
<LoggingComputer />
<EventNumber>0</EventNumber>
<EventCategory>3</EventCategory>
<EventLevel>0</EventLevel>
<UserName />
<Description>Detected Entry: $Data///row$</Description>
<Params />
</ConditionDetection>
</MemberModules>
<Composition>
<Node ID="Mapper">
<Node ID="DS" />
</Node>
</Composition>
</Composite>
</ModuleImplementation>
<OutputType>System!System.BaseData</OutputType>
</DataSourceModuleType>
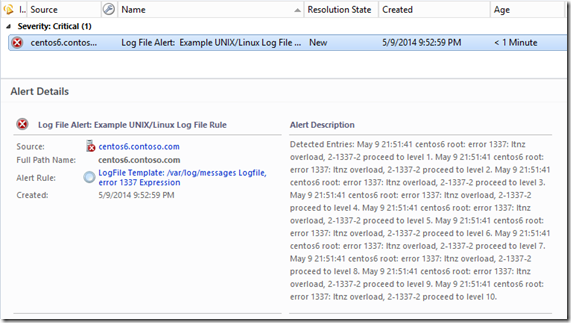
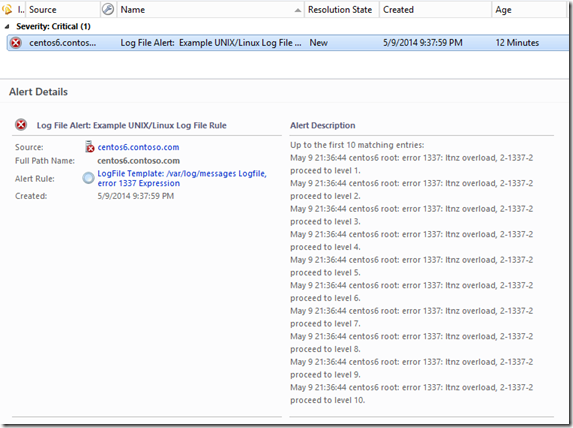
To change this behavior though, we want to focus on the GenerateAlert response. Click Edit to view the settings, and locate the Alert description field. There are two ways we might accomplish our goal. The first is we can include ALL lines that have matched in the past interval, but all the lines appear run together on a single line. Or we can include up to the first 10 matching lines by addressing those first 10 rows of the data returned individually.
To get all the data collapsed on a single line, use the following as the description:
Detected Entries: $Data///SCXLogProviderDataSourceData$
To get only the first 10 matches, but each on their own line, use this as the description:
Up to the first 10 matching entries:
$Data///row[1]$
$Data///row[2]$
$Data///row[3]$
$Data///row[4]$
$Data///row[5]$
$Data///row[6]$
$Data///row[7]$
$Data///row[8]$
$Data///row[9]$
$Data///row[10]$
For reference, here is what the Alert Context for one of these rules looks like. This is the data that will be processed for the variable substitution in the alert description.
< DataItem type =" SCXLogProviderDataSourceData " time =" 2014-05-09T20:52:59.9407442-04:00 " sourceHealthServiceId =" 146F6C57-9775-06DE-9590-B2B9A2D11920 " >
< SCXLogProviderDataSourceData >
< row > May 9 20:50:30 centos6 root: error 1337: ltnz overload, 2-1337-2 proceed to level 1. </ row >
< row > May 9 20:50:30 centos6 root: error 1337: ltnz overload, 2-1337-2 proceed to level 2. </ row >
< row > May 9 20:50:30 centos6 root: error 1337: ltnz overload, 2-1337-2 proceed to level 3. </ row >
< row > May 9 20:50:30 centos6 root: error 1337: ltnz overload, 2-1337-2 proceed to level 4. </ row >
< row > May 9 20:50:30 centos6 root: error 1337: ltnz overload, 2-1337-2 proceed to level 5. </ row >
< row > May 9 20:50:30 centos6 root: error 1337: ltnz overload, 2-1337-2 proceed to level 6. </ row >
< row > May 9 20:50:30 centos6 root: error 1337: ltnz overload, 2-1337-2 proceed to level 7. </ row >
< row > May 9 20:50:30 centos6 root: error 1337: ltnz overload, 2-1337-2 proceed to level 8. </ row >
< row > May 9 20:50:30 centos6 root: error 1337: ltnz overload, 2-1337-2 proceed to level 9. </ row >
< row > May 9 20:50:30 centos6 root: error 1337: ltnz overload, 2-1337-2 proceed to level 10. </ row >
</ SCXLogProviderDataSourceData >
</ DataItem >
Looking at the above, and if you have any experience with XPath queries, you can see the alert description settings proposed above are nothing too complicated. The first method above addresses the SCXLogProviderDataSourceData XML node, and returns everything below on one line. The second method calls out to the row node and calls out to the [1], [2], [3], … instance of the row entry. If only 3 rows are returned, the other 7 will remain blank and thankfully not result in an error.
Follow up question. Now with the matching lines in the alert, how do we generate a new alert for every set of matches found, but not for each line found? By default, the Data Source is configured with IndividualAlerts set to false which causes any future log matches by the rule to increment the existing alert’s repeat count. Whereas when IndividualAlerts is set to true, each line creates its own alert. We can address this using the alert suppression settings (view the rule properties/configuration, and modify the GenerateAlert response where there will be an Alert Settings button at the bottom). And we only need one entry:
$Data///SCXLogProviderDataSourceData$
By adding that line above, it forces an additional evaluation to the alert suppression, and assuming there are date/time stamps in the log file, even if the same set of errors match, we’ll receive a new alert. Be sure to close any open alerts that were raised prior to modifying the suppression settings. Otherwise the alerts will still enforce suppression as it was configured at the time the alert was raised.
Using this information you should be able to custom tailor the alert description better than what the template provides out of the box, and what I really appreciate about these methods is that it can all be done from the Operations Console.
Now for the instant gratification types, screenshots!
Known Issues
- Once you modify the alert settings, you should not edit the rule using the Management Pack Template. In fact, once you have the log file rules dialed-in, I would open the MP XML and remove any line that begins with <Folder ID="TemplateoutputMicrosoftUnixLogFileTemplate or <FolderItem ElementID="LogFileTemplate, and be sure to tidy up any remaining <Folders> and <FolderItems> tags if you don’t have any legitimate folders for Monitoring views.
IF YOU DO EDIT THE MP TEMPLATE, YOU WILL OVERWRITE CHANGES MADE TO THE RULE AND ALERT DESCRIPTION WITH THE DEFAULTS. - There is a limit to ten lines using the individual row method. The limit is imposed by ten alert parameters max. You could increase this by passing as many rows as you could squeeze into the event data mapper data source by copy/pasting from the UNIX/Linux Core Library (and grab Microsoft.Unix.SCXLog.Native.DataSource too since it will be needed and is marked internal), or even insert a custom data source for post-processing. This is more ideal if you consistently author using more robust authoring tools and/or the raw XML.
- Technically we are duplicating what can amount to a significant amount of data depending on how often the alert triggers. The log entries will be stored in the alert context field, as well as the alert parameters field. Generally speaking this shouldn’t be too much of a concern, but it’s worth mentioning in case anyone is planning on alert archives with 10’s of 1000’s of these.
Resources
Adding custom information to alert description (s) and notifications – An oldie, but goodie on Kevin Holman’s blog. My go to link for alert variable reference.
AlertParameters (UnitMonitor) – This is good reference on the fact there are only 10 alert parameters. The AlertSettings block is different for rules, so beware.
SCOM 2012: Authoring UNIX/Linux Log File Monitoring Rules – Good article on custom authoring Log File Monitoring rules, plus details on using the correlated condition detect module with UNIX/Linux logs (need x occurrences in y time).


