Building a dashboard on top of a web API with Power BI and Azure – Part 1
In Part 1 of this series we will see what an API is and how to use one with Power BI Desktop to build a simple dashboard. In Part 2 we will see how to design a more complete architecture capable of storing data over time. In Part 3 we will implement that architecture.
An Application Programming Interface, or API, is an interface that allows different systems to communicate with one another. However, instead of being graphical and designed to be used by human beings (like a web page or an app), an API is intended to be accessed through code.
A good example of that is the Open511 DriveBC API, published by the Ministry of Transportation and Infrastructure of British Columbia, Canada. The Ministry offers the public two ways to be informed of every event happening on the road of BC in real time:
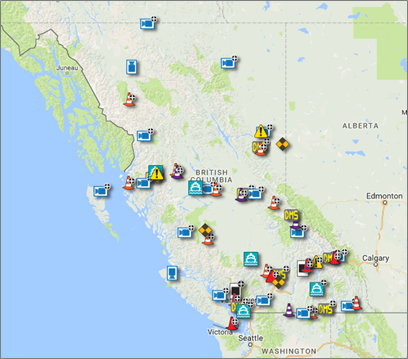
- A website: drivebc.com, is for the public human consumption and provides events on maps or lists:
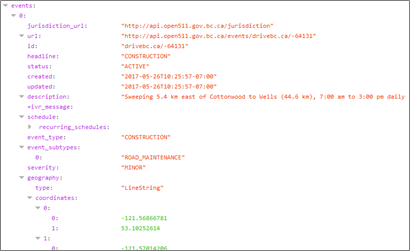
- An API: the driveBC API, to allow developers to extract the same data in a format optimized for automated processing, so they can build their own applications on top of it:
Now if the goal is to build a Power BI dashboard, the best way to get the data is, of course, going to be through the API. Data coming from the API will be consistently formatted, which is perfect in this situation as it simplifies development.
Speaking of format, the DriveBC API offers two: XML and JSON (see format negotiation). We know Power BI is capable of handling both, my personal preference is for JSON, as it is usually less verbose which means more straightforward to handle.
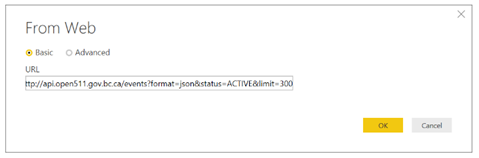
After reading the documentation and experimenting a bit, we are able to build the first API call, which is basically just a web link, that provides us the list of active events in BC in JSON format: https://api.open511.gov.bc.ca/events?format=json&status=ACTIVE&limit=300
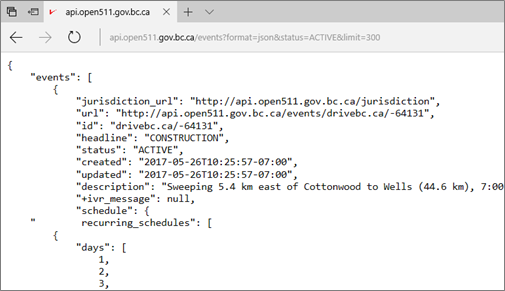
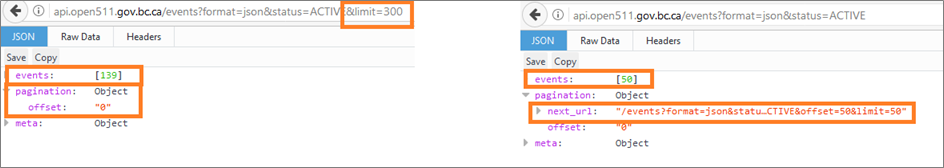
I added the &limit=300 in the call because the API is smartly designed and uses what is called pagination - a simple mechanism by which the complete list of events returned is actually split in pages showing only a certain number of items by page. So by default, the API will only deliver the first 50 items and prompt a link to the following 50.
I didn't want to deal with the implementation of that mechanism in Power BI in my first prototype (spoiler alert: done via functions) so I asked for a higher limit directly in the call. Note that Firefox has an integrated JSON reader which helps a lot when trying to understand what is being returned in a call:
With all that covered, it is easy to build a first dashboard, starting in Power BI Desktop:
- Get Data > From Web
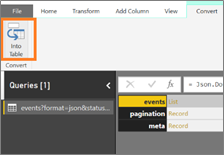
- Let's make the result a table
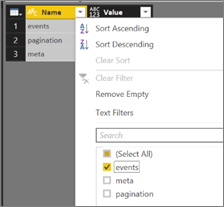
- Then filter to keep only the events
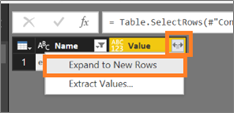
- Then expend the list to new rows
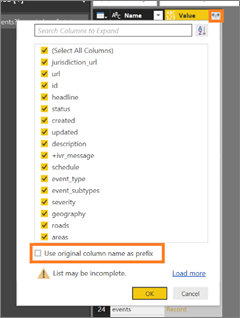
- And finally extract the columns
From there it's standard data cleansing (apart from dealing with points vs lines geographies, in my first iteration I just rounded the coordinates associated to lines to 2 decimals to go around the current map plotting limit) that will ultimately allow us to build a dashboard. Here is, for example, one that work well for mobile use (direct link):
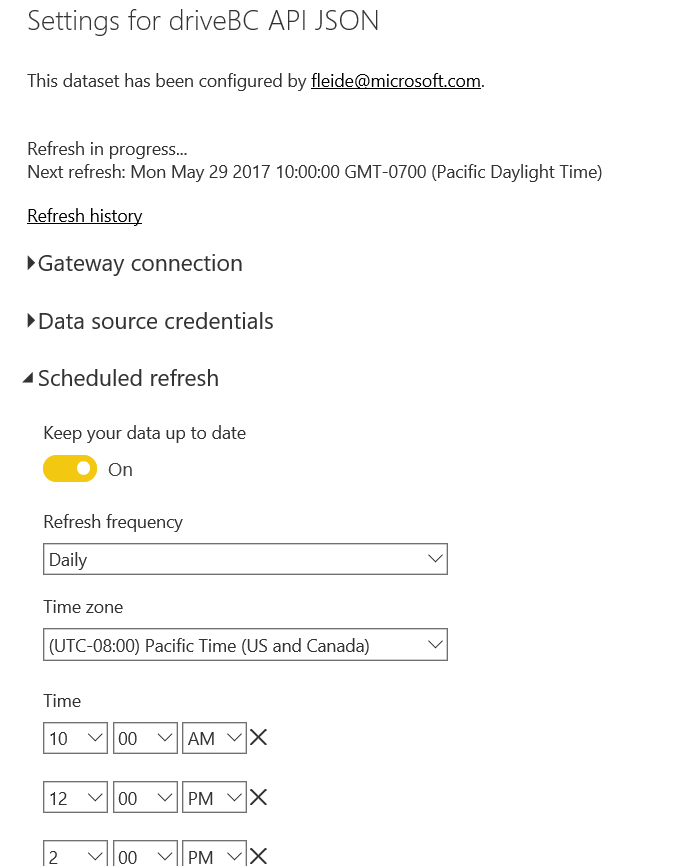
Once published, we can set up a scheduled refresh without even needing a Gateway. Since the data source is online, the Power BI service can reach it directly:
One issue with the current architecture is that it doesn't store data over time. When the model is refreshed, it is first flushed, then filled with the data currently published by the API and archived events are lost. It would be neat if we could instead store regular snapshots of that data. That way we would be able to see the evolution over time of our metrics, and detect potential trends or seasonality We will need the help of some Azure services to achieve that, and we will see how in Part 2.