Datazen vs. Power BI: When and Why?
Update: Following the announcement of the reporting roadmap for SQL Server and Power BI at PASS 2015, I’ve written a follow up to this blog post. The information below is still valid and has been updated, but for a forward looking analysis of the Microsoft visualization tools, please read my new blog post: Positioning of Microsoft Reporting Tools and Roadmap: Excel, Power BI, Datazen, SSRS!
My last post provides an overview of Microsoft’s platform for analytics, let’s now focus on the visualization tools. Since the Datazen acquisition, I’m often asked how Power BI and Datazen compare: which tool should I use?
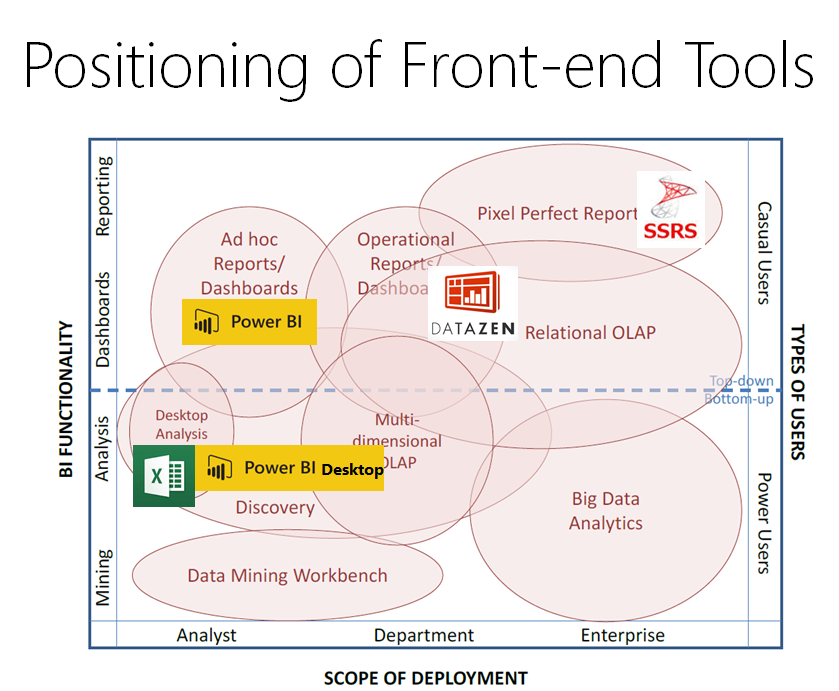
In practice the answer is pretty simple: let’s consider the picture below.
First, you have SQL Server Reporting Services in the top right, which is a great platform for pixel-perfect reports. Usually those reports are built by IT professionals and consumed by casual users. As announced at Ignite, SQL Server 2016 will bring new features: a new modern look and feel, parameter layout customization, and new visualizations.
Datazen fits perfectly a gap in the Microsoft offering for corporate dashboards that offer the best mobile experience. Datazen works best for executive level dashboarding to display KPIs, charts, and interactive timelines then published to all mobile platforms. Datazen dashboards can be created by business analysts, but the server-side configuration of KPIs, and datasets must be done by IT professional. Datazen will be an integral part of SQL Server 2016, but is available today for customers with SQL Server Enterprise (2008+) with Software Assurance.
You can also build dashboards and reports with Power BI, but here the objective is really focused on self-service BI. The vision is to democratize BI, create a data culture: insights can come from anyone, anywhere, at any time. Power BI provides the tools for casual users to interact with data, business analysts to publish and share analytical models, IT to expose their SQL Server Analysis Services cubes, and developers to build on top of the platform.
Finally Excel is the most widely used application for data analytics with more than one billion Microsoft Office users. With Excel and the Power Tools, we empower power users inside the software they want to use with new functionality to make their work more efficient, more scalable, and convertible to enterprise-grade SQL Server, SharePoint and Power BI solutions.
With this in mind, a common scenario would be for Power Users to explore datasets inside of Excel to determine the business logic that will meet their business needs and the visualizations that will communicate best to stakeholders. The result is not a throw away prototype; the file can then be shared to Power BI and SharePoint to a community of casual users.
Once the requirements have settled, IT can extract the business logic from the Excel file by transferring the Power Pivot model to Analysis Services and enriching it. With SQL Server 2016, IT will also be able to transfer the Power Query logic to SSIS or Analysis Services Tabular will natively support Power Query as data source.
Finally dashboards can then be recreated by IT in Datazen to offer the best mobile BI experience on the market. Datazen is not meant as a tool for data exploration: simply dashboard visualizations.
Another important factor to consider is that Datazen can be deployed fully on-premises. Some customers prefer to deploy Datazen in Azure: this can currently be achieved in IaaS mode. While at this point Power BI is cloud only, SharePoint offers capable self-service BI functionalities on-premises.
Now the next question is usually about the roadmap and future integrations between Datazen and Power BI. At this point we’ll have to wait and see future announcements.
Have fun with Datazen!