Big Data Hackathon – a Story from a Winning Team
This blog post was created collaboratively by the winning team of the Big Data Hackathon in Data Visualization category (Microsoft Canada office, Mississauga ON, March 13-14, 2015).
Big Data Hackathon Team members:
Kosta Zabashta , Ontario Teachers' Pension Plan
Marcello Panaccione , Ontario Teachers' Pension Plan
Rayis Imayev , Dawn InfoTek Inc.
Selcuk Beydilli , Ontario Teachers' Pension Plan
Big Data, what a term! Some people instantly think of a huge, sometimes cumbersome volume of information, others define it with three or four Vs (volume, velocity, variety, and variability). Debates, other social and technical events are organized in order to promote various technologies that work with big data sets.
One of these events (Big Data Hackathon in Mississauga) was organized by Microsoft Canada to call for data scientists, developers and simply data enthusiasts for a contest to select a specific data science problem and then solve it with the help of Microsoft Big Data and BI tools in 2 categories (Data Modeling and Data Visualization).
A team of four such data enthusiasts (Kosta Zabashta, Marcello Panaccione, Rayis Imayev, Selcuk Beydilli) got together to participate in this contest. We are all very passionate about data, and this event presented an exciting opportunity to work together first hand with Microsoft's emerging data science tool set. We got together regularly in the days leading up to the event, our discussions focused around familiarizing ourselves with these technologies and how we might approach the problem on game day. At first we were excited to try the new Azure Machine Learning capabilities in the Data Modelling track, but then stuck with the more familiar tools in the Data Visualization category. Although in future, we most definitely will take a stab at Machine Learning! We obtained trial subscriptions for Power BI, Office 365 and Windows Azure leading up to the event. On the day of the contest a fifth member of the team joined us (Brad Morrison), so we had become a team of five.
We really didn’t know what to expect on the day of the event, our impression was that we would select to compete in one of the two categories (Data Modeling or Data Visualization), be given a specific data science problem in that category to solve, certain database sets would be provided, and whomever developed the most intriguing solution selected by the judges would be called the winner in that category. Actually, the event was even more exciting and challenging! We had been provided with a set of publicly available data sets (https://blogs.technet.com/b/cansql/archive/2015/03/12/microsoft-big-data-hackathon-resources.aspx); we chose data of our own interests and utilized HDInsight & Power BI tools to develop our solution. We spent the first few hours digging through various resources and decided to work with Toronto Parking Ticket information (https://www1.toronto.ca/wps/portal/contentonly?vgnextoid=ca20256c54ea4310VgnVCM1000003dd60f89RCRD); the data set was big, containing data for the past 7 years and was relevant for the region that we all lived in. As we analyzed the data, we thought of different ways to correlate the parking ticket infractions with other data sets, such as weather or city events. In the interest of time we focused on the additional data sets provided by the Toronto Green P Parking location (https://www1.toronto.ca/wps/portal/contentonly?vgnextoid=b0993228eb22a310VgnVCM1000003dd60f89RCRD). The objective was to prove (hopefully) that the number of parking tickets would be lower in areas of public parking spaces.
We imported the Parking Tickets data files into our Azure Blob storage, HDInsight cluster in Azure was created and all the data files were organized into Hive tables to be further queried for our data insights.
Power Queries were built to bring both Hive table’s data and JSON files with Parking locations, datasets were then moved to PowerPivot model and uses as a source for PowerBI and PowerMap visualization. During a preliminary comparison of parking tickets data with parking locations we had discovered a few “hot” spots with high volume of parking infractions at the of December of 2014, mostly in downtown, and there was one such hot spot with a street address “34 LITTLE NORWAY CRES” that was right across the Billy Bishop Airport. A little bit further research was done to establish a possible link with the number of flights in the airport. Since there was no data for December 2014 flights available yet, a decision was made to build a correlation analysis of flights statistics data with parking infraction info for the period of 2013.

And again, we were able to find NAV Canada monthly statistics data sets publicly available. We just needed to build additional Power Queries, filter data for the Billy Bishop Airport only and combined this into one data set for 2013:
i. https://www.statcan.gc.ca/pub/51-007-x/2013001/t001-eng.htm
ii. https://www.statcan.gc.ca/pub/51-007-x/2013002/t001-eng.htm
iii. https://www.statcan.gc.ca/pub/51-007-x/2013003/t001-eng.htm
iv. https://www.statcan.gc.ca/pub/51-007-x/2013004/t001-eng.htm
v. https://www.statcan.gc.ca/pub/51-007-x/2013005/t001-eng.htm
vi. https://www.statcan.gc.ca/pub/51-007-x/2013006/t001-eng.htm
vii. https://www.statcan.gc.ca/pub/51-007-x/2013007/t001-eng.htm
viii. https://www.statcan.gc.ca/pub/51-007-x/2013008/t001-eng.htm
ix. https://www.statcan.gc.ca/pub/51-007-x/2013009/t001-eng.htm
x. https://www.statcan.gc.ca/pub/51-007-x/2013010/t001-eng.htm
xi. https://www.statcan.gc.ca/pub/51-007-x/2013011/t001-eng.htm
xii. https://www.statcan.gc.ca/pub/51-007-x/2013012/t001-eng.htm
Our final result was a set of PowerBI analytical charts and a PowerMap tour video that showed all the steps of analysis and getting into attempt to find a correlation between parking infractions and air flights.


A PowerMap Tour of the datasets was posted to youtube:
https://www.youtube.com/watch?v=3UMtaYoYHiY
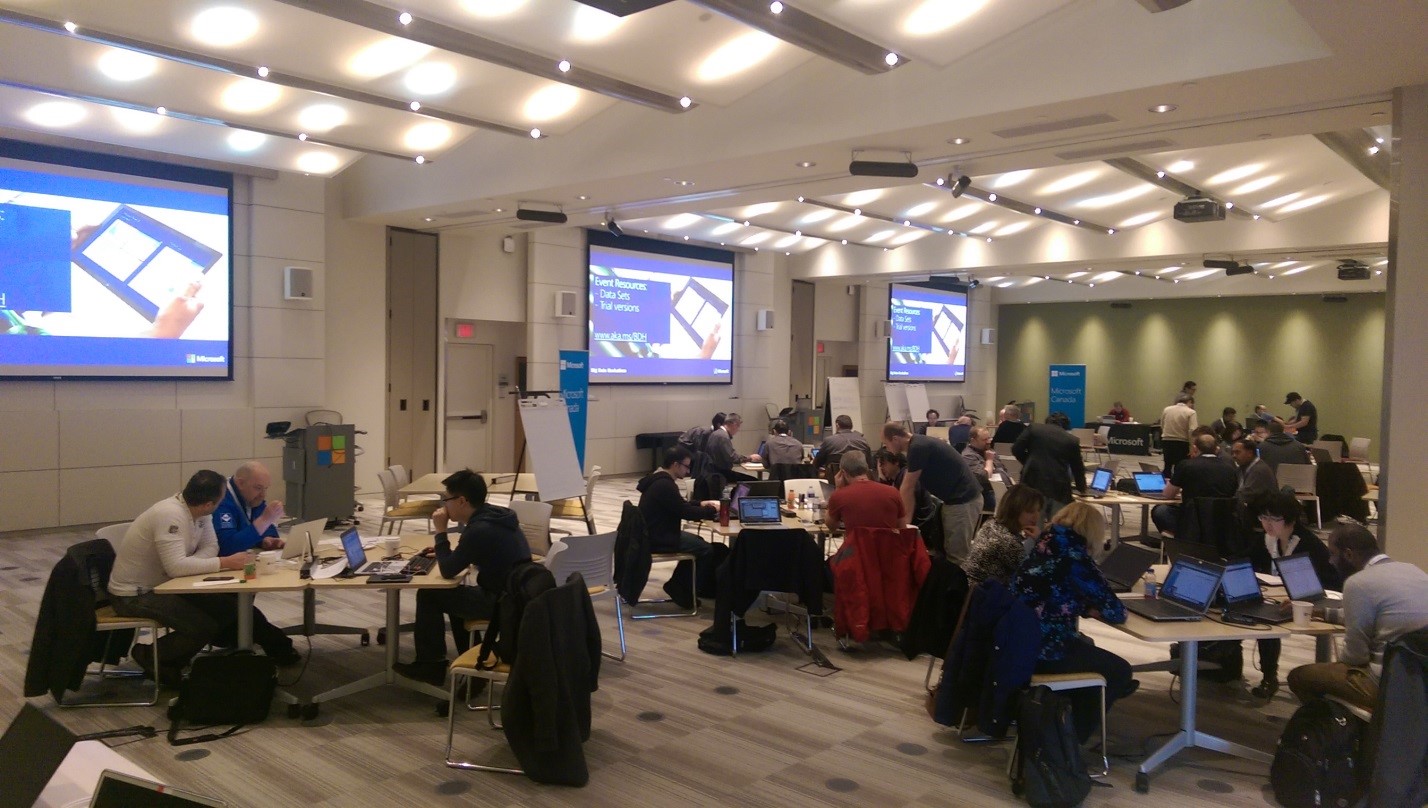
At the end of the second day of the hackathon we were all tired, but happy that we had learned so much working with the new Microsoft toolsets including Azure and Power BI. We were all amazed with the variety of publicly accessible data (you could burn a lot of hours combing through those data sets). The venue was outstanding! Prior to the start of the challenge, Microsoft began by introducing the tool set and resources were available throughout the course of the event to answer questions. The food also kept coming which helped to get some of us who braved working throughout the night!
We offer the following suggestions for future BDH attendees:
- Prepare by familiarizing yourself with the technologies that are to be used
- Investigate methods for moving and querying data from Azure if you haven't done it yet
- Spend some time analyzing publicly available datasets, it will save you time during the actual contest
- Build a simple but a complete data scenario solution from beginning to end and then gradually add additional data attributes to your data sets
- Solution should not be about using various technologies but rather how to solve a problem with a data story behind it
- And most importantly, be a good team member! This is one challenge where you’ll need to rely on others in your team to get the work done, because working with big data sets collaboration of more than one person usually helps!