Unable to activate new SharePoint 2013 search topology
During my tests with a provisioning script for SharePoint 2013 I run into a Problem with the SharePoint 2013 search. The provisioning of the search service application and the activation of a new search topology failed while activating the new search topology. I used a single VM for the script tests so the SharePoint farm topology was really simple. I started looking after the usual suspects, Windows services (SharePoint Search Host Controller, SharePoint Server Search 15) and IIS application pools but there were all fine.
The search service application administration in the Central Administration displayed the message "Unable to retrieve topology component health states. This may be because the admin component is not up and running".
Then I started to check the ULS logs. There were a lot of critical messages in the ULS log regarding CSS addresses:
Content Plugin can not be initialized - list of CSS addresses is not set.
I assumed that this message was the result of the unfinished search provisioning and not the cause of the problem so I filtered the entries in the ULS log by the "Product" column containing the word "search". This gave me an overview of the search provisioning process and I found entries of the process hostcontrollerservice.exe which reappears every 20 - 30 seconds:
HostController: Starting node AdminComponent1 on system 8C5512 marked for automatic startup - threadId: 12
HostController: Restarting node AdminComponent1 on system 8C5512 marked for automatic startup - threadId: 18
HostController: Restarting node AdminComponent1 on system 8C5512 marked for automatic startup - threadId: 18
It looks like the SharePoint system was trying to start the AdminComponent1 process but the process stops after a couple of seconds.The AdminComponent is one of the processes that is started as a child process of the hostcontrollerservice.exe. So I checked the running tasks with the Sysinternals Process Explorer (in tree mode) and found the following:

As you can see there are no child processes beneath the hostcontrollerservice.exe process. In a working SharePoint 2013 search system the are normally five or six child processes.
So the question was why do I not have any running child process? I checked the command line of the child processes on a SharePoint system with working search with the Process Explorer. The noderunner process of the admin component was started there with this command line:
"C:\Program Files\Common Files\Microsoft Office Servers\15.0\Search\Runtime\1.0\NodeRunner.exe" --noderoot "C:\Program Files\Microsoft Office Servers\15.0\Data\Office Server\Applications\Search\Nodes\C5539A\AdminComponent1" --addfrom "C:\Program Files\Microsoft Office Servers\15.0\Data\Office Server\Applications\Search\Nodes\C5539A\AdminComponent1\Configuration\Local\Node.ini" --tracelog "C:\Program Files\Microsoft Office Servers\15.0\Data\Office Server\Applications\Search\Nodes\C5539A\AdminComponent1\Logs\NodeRunner.log"
As you can see the command line contains a parameter tracelog:
--tracelog "C:\Program Files\Microsoft Office Servers\15.0\Data\Office Server\Applications\Search\Nodes\C5539A\AdminComponent1\Logs\NodeRunner.log
I opened the path "C:\Program Files\Microsoft Office Servers\15.0\Data\Office Server\Applications\Search\Nodes" on the not working SharePoint system and found a six digit sub folder with another folder named AdminComponent1 and a subfolder named Logs. In the logs folder there was a file NodeRunner.log which contained a lot of exception messages:
Caught exception in node activator: System.Reflection.TargetInvocationException: Exception has been thrown by the target of an invocation. ---> System.OutOfMemoryException: Exception of type 'System.OutOfMemoryException' was thrown.
at Microsoft.Ceres.CoreServices.Node.NodeActivator.ActivateNode(IDictionary`2 configuration)
--- End of inner exception stack trace ---
at System.RuntimeMethodHandle.InvokeMethod(Object target, Object[] arguments, Signature sig, Boolean constructor)
at System.Reflection.RuntimeMethodInfo.UnsafeInvokeInternal(Object obj, Object[] parameters, Object[] arguments)
at System.Reflection.RuntimeMethodInfo.Invoke(Object obj, BindingFlags invokeAttr, Binder binder, Object[] parameters, CultureInfo culture)
at System.Reflection.MethodBase.Invoke(Object obj, Object[] parameters)
at Microsoft.Ceres.CoreServices.NodeRunner.Runner.StartNodeController(EntryPoint entryPoint)
at Microsoft.Ceres.CoreServices.NodeRunner.Runner.Start()
It looks like I have a memory problem which prevents the noderunner processes from starting correctly. This was very odd because the system had 32 GB RAM. I searched for the exception message and found some results pointing me to the solution. It is possible to limit the memory consumption of the noderunner processes with an entry in the file noderunner.exe.config in the folder "C:\Program Files\Common Files\Microsoft Office Servers\15.0\Search\Runtime\1.0". I found the following entry in my noderunner config file:
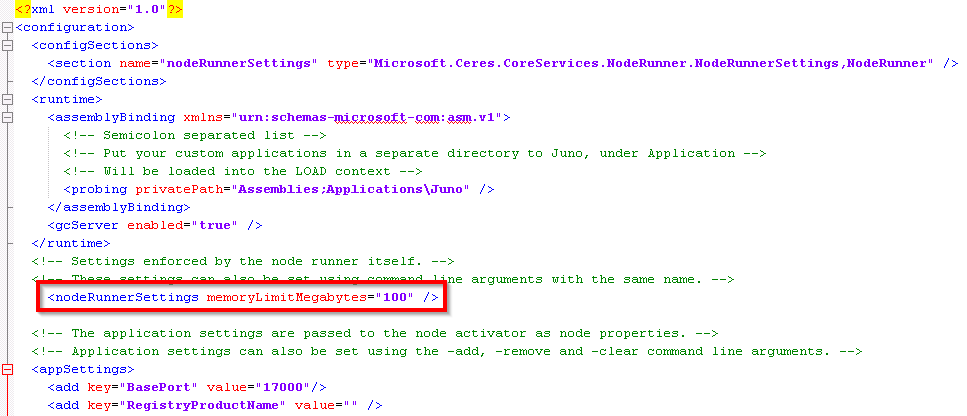
I changed the memoryLimitMegabytes value of the tag <nodeRunnerSettings memoryLimitMegabytes="100" /> to 0 (which means no restriction) and restarted the Search Host Controller Windows service. After a couple of seconds the hostcontrollerservice.exe in the Process Explorer showed the expected child processes:

To verify that the search service application was really working I went to the Central Administration and the search administration and it showed me the wanted status:
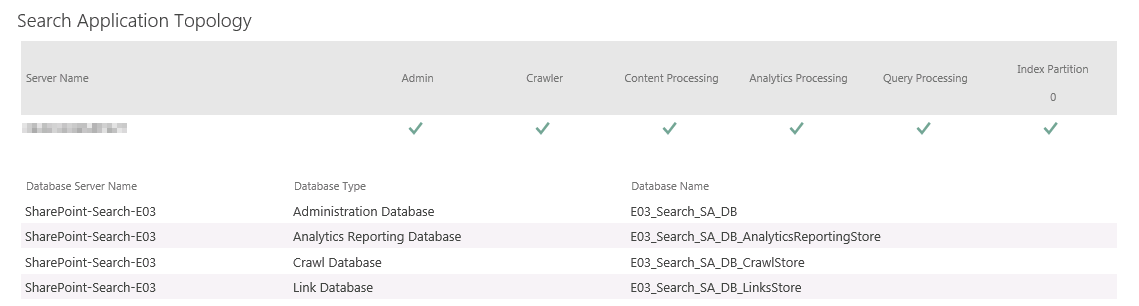
Problem solved!