Project Server 2010 Queue is VERY Slow
I ran into a problem with a customer late last week that I had never encountered before. That's not really saying much, but the solution surprised me!
The timesheet queue was filled with “waiting to be processed” jobs that had begun to pile up on Friday morning. There were more than 7,000 jobs waiting to be processed and this was causing anxiety among the users and admins because Friday is “submit your timesheet” day.
I screen shared with an administrator and we saw four Timesheet Queue related jobs were sitting at a State of "Processing" with a completion of 100%; they were just sitting there and not going away. I cancelled the jobs thinking they were hung somehow and knowing it would only affect four users’ timesheets. That seemed to resolve the problem as the queue began to show fewer jobs on every refresh, so we ended the call. But... I checked in with the customer later in the day and the queue was still at 1500 jobs and they were processing “very slowly”.
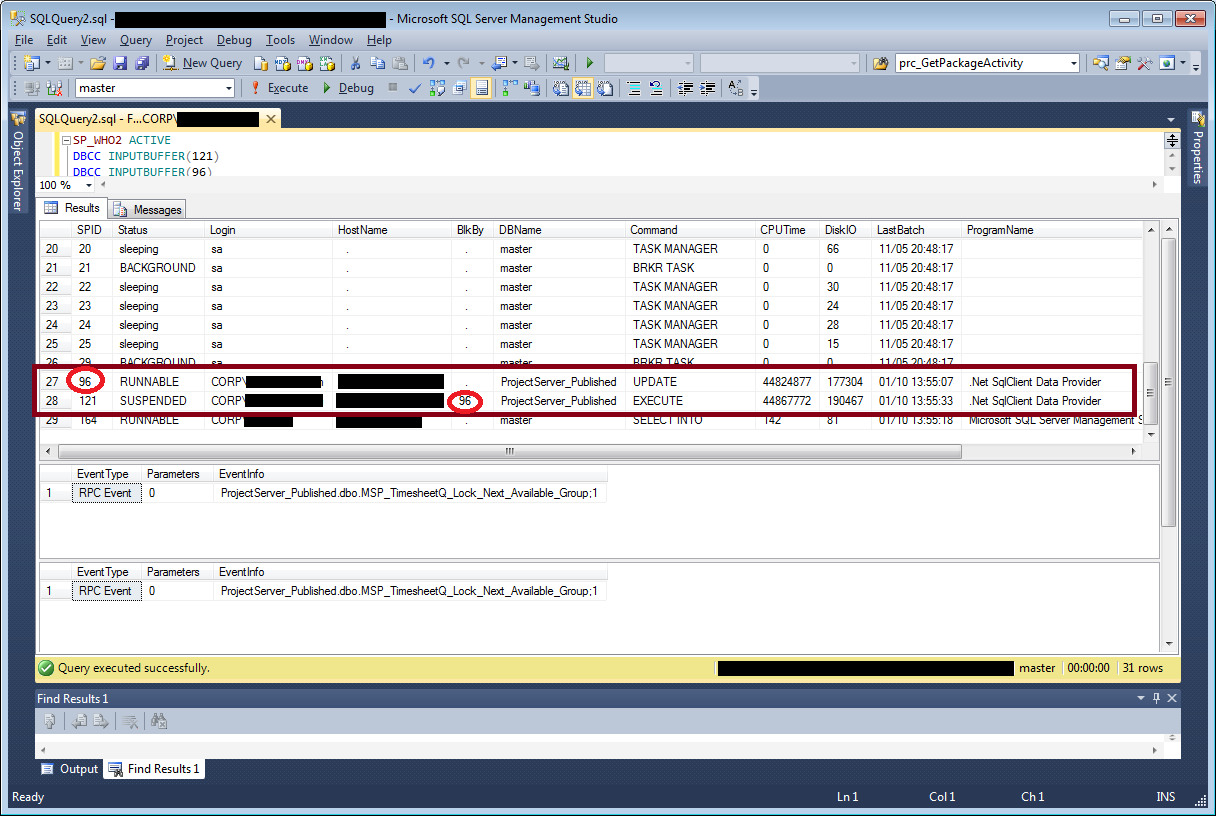
You can see in the screenshot above that two jobs were interfering with each other; the same stored procedure, projectserver_published.dbo.msp_timesheetq_lock_next_available_group, being run from either app server were blocking each other and couldn’t run simultaneously. CPU time and disk I/O were off the charts. A different SQL query showed that each procedure was taking almost a second each. The customer's SQL DBA ran the query below to clear the process cache in the SQL Server, which caused SQL to refresh/recompile the stored procedure’s execution plans. This caused the queue to start running smoothly again and to process jobs very quickly. When we finally ended the call, there were 7 active jobs in the queue and they were all project save/publish related.
Here’s a link to the free process cache command the DBA used; DBCC FREEPROCCACHE (Transact-SQL) - https://technet.microsoft.com/en-us/library/ms174283.aspx
Researching the problem further, I found this blog article from Brian Smith sums up what we were seeing and provides precisely the fix the customer DBA used - https://blogs.msdn.com/b/brismith/archive/2012/09/19/when-your-project-server-queue-slows-down.aspx
You can see from Brian’s example that the execution time for the stored procedure is 21 seconds:
08/09/2012 16:10:25.10 Microsoft.Office.Project.Server (0x36D0) 0x2E58 SharePoint Foundation Monitoring b4ly Verbose Leaving Monitored Scope (FillTypedDataSet -- MSP_ProjQ_Lock_Next_Available_Group). Execution Time=21102.179988219601 <correlation ID>
In the customer's logs, the execution times for this procedure were around 30 seconds:
01/10/2014 02:33:38.50 Microsoft.Office.Project.Server (APP123:0x1384) 0x023C SharePoint Foundation Monitoring b4ly High Leaving Monitored Scope (FillTypedDataSet -- MSP_TimesheetQ_Lock_Next_Available_Group). Execution Time=31384.190169421 16aab2dd-88e0-4ea5-b686-6baedd1882e8
I believe we ended up in this situation because the SQL Server has been up and running for a long period of time. Clearing the process cache on the SQL Server was precisely the correct action.
Now if I see this behavior again, I will recognize it quickly from the queue behavior and the ULS logs and take the corrective action. As proactive actions, you can schedule a FREEPROCCACHE job or restart your SQL Server at a regular interval.
