Modifying the Queue Length for Exchange App Pools in IIS
In support, we handle a large number of cases - many of which are performance related. A trend I've seen involves administrators preparing their Exchange environment by making changes to settings that, unknowingly to them, may cause problems down the road. I decided to write this article regarding one of the more popular changes in IIS - increasing the Queue Length on individual app pools:
What is the Queue Length setting in IIS?
Benjamin Perkins has a short blog post briefly going over the queue length and how to change it (in IIS 7), however this post was written primarily for developers of web applications. Exchange utilizes IIS extensively for many services, so it is important to remember that while some IIS changes may be great for custom web applications, they can also severely impact how Exchange functions.
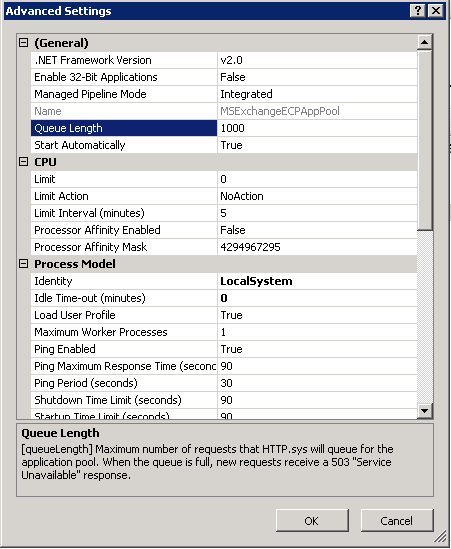
So what exactly is the queue length setting in IIS and how does it work? Imagine each IIS application pool as a bucket. And requests from clients are placed into each corresponding bucket. As the request is added to the bucket, the CPU takes the request out of the bucket to process it. Now, imagine a large number of requests - more than the CPU can handle at once hitting the bucket. Or, maybe something else is holding up the CPU, so that it can't empty the bucket as quickly as it is filling up. This is a very high level view of how the queue length works. As the CPU is unable to keep up with incoming requests, the new requests are added to the queue. The request queue limit is basically, the limit on the number of requests the bucket can hold before IIS starts denying new requests.
To put it simply, the queue length is NOT the number of concurrent requests a particular app pool can handle. It is only a precautionary measure to prevent the server from falling too far behind in processing requests.
So should I change it?
As Benjamin mentioned in his article, "in most cases the default configuration will work best, therefore only make modifications when you are certain of the need and impact." This holds true with Exchange. The default queue length is 1000 for each app pool in all versions of IIS so far. And in most cases, 1000 is plenty.
The maximum value we typically ever recommend setting the queue length to is 10,000.
In Exchange, we typically refer to raising the queue length on an app pool as a 'band aid fix.' This is because we know, in most cases, raising this value is unnecessary - so why should it be necessary in this particular case?
Let's consider a real world scenario: You start receive complaints that your company's ActiveSync devices are having intermittent issues synchronizing. After some fancy investigative research, you've determined that a single CAS server is returning 503 errors very frequently to requests. More investigation finds that you are exceeding the queue length (more information on how to detect this below). The system appears to be healthy - CPU is averaging 30-60%, which is on par with your previous baseline performance data and no other application pools appear to be affected - so why not simply bump that queue length up to 5000 and let those devices get their sync on?
Well - the more important question that I ask when I'm investigating an issue for a customer is, why. Why did we all of a sudden exceed the queue length? And why are we queueing this many requests? CPU appears to not be adversely affected, so the server doesn't appear busy in that aspect. And most importantly, what changed?
Sure, band-aiding the issue by increasing the length may resolve the impact, but when you think later down the road - will increasing the number of queued requests that we allow for this one app pool potentially cause performance issues later, further complicating the end resolution? It's definitely a possibility.
So, yes, you can increase the queue length - but unless you have specific guidance from Microsoft, it should generally be used to mitigate impact while you continue investigating the actual root cause of the issue. Additionally, it should be noted that recycling the app pool will also clear the queue with little impact, but then allow the server to build that queue back up so that we can monitor and investigate the actual cause - this is probably a better method of troubleshooting the issue than simply increasing the queue length in most cases.
As a side note - recycling the app pool is different from stopping and starting the app pool:
From the TechNet article: https://technet.microsoft.com/en-us/library/cc770764(v=WS.10).aspx
"Occasionally, you may have to immediately recycle an unhealthy worker process instead of waiting for the next configured recycle. Rather than abruptly stopping the worker process, which can cause service interruptions, you can use on-demand recycling. Overlapping recycling, the default, lets an unhealthy worker process become marked for recycling, but continues handling requests that this unhealthy process has already received. It does not accept new requests from HTTP.sys. When all existing requests are handled, the unhealthy worker process shuts down."
The same goes with lowering the setting. I recently had a customer, whom, as a precaution, decided to set the limit to 120. Yes, that is 880 less than default. As you could imagine, when they ended up having performance issues, this intensified the effect - and, of course, added another layer of symptoms that had nothing to do with the root cause.
How do I know if I'm hitting the limit set by the Queue Length?
There are a few different methods that you can use to determine if you are hitting the limit.
First, when the limit is reached, the server starts denying connections to that particular app pool by returning a 503, which translates to "Service Unavailable." So the first question would be, are you getting 503 responses? If you are getting 401 responses, then you probably aren't hitting the limit - as 401 translates to "Unauthorized," which indicates IIS received your request, has attempted to authorize you, and was unable to.
When the limit is reached however, the server is rejecting requests before they even reach IIS. Which means you won't see these 503 errors in the IIS logs. These 503's occur before the IIS logs, in the HTTPERR logs.
The default location for the HTTPERR logs is C:\Windows\System32\LogFiles\HTTPERR
HTTPERR logs are the log files for the HTTP.sys driver. As mentioned in this TechNet article:
"When you create a Web site, IIS registers the site with HTTP.sys, which then receives any HTTP requests for the site. HTTP.sys functions like a forwarder, sending the Web requests it receives to the request queue for the user-mode process that runs the Web site or Web application. HTTP.sys also sends responses back to the client."
So, when hitting the request queue limit, the request is being denied at the HTTP.sys driver level, thus logging the failure in the HTTPERR logs. When hitting the limit, you'll normally see a long list of 503's in these logs, such as:
014-03-05 20:41:52 10.0.0.24 56086 10.0.0.25 443 HTTP/1.1 POST /Microsoft-Server-ActiveSync/Proxy?User=jdoe&DeviceId=ApplXXXXXXXXXXX&DeviceType=iPhone&Cmd=Sync 503 2 QueueFull MSExchangeSyncAppPool
Notice the "503 2"? That's a 503.2 (503 with a sub status of 2), which translates to "Service Unavailable: Concurrent request limit exceeded"
Note, you may also see 503.3, which translates to "Service Unavailable: ASP.NET queue full". This is slightly different - see this TechNet article.
IIS literally gives you the answer with the reason QueueFull, but be aware that sometimes this can show N/A as well.
And, of course, the logs also indicate which app pool the rejected request was attempting to access, in this case being the MSExchangeSyncAppPool - or ActiveSync - matching up with our earlier scenario.
Well - what if I want to monitor for this proactively?
We've got you covered! As you may know, PerfMon offers thousands of counters that help identify baselines - and point out potential issues. Keep an eye on the following counter:
Http Service Request Queues \ CurrentQueueSize
There is a counter for each application pool (Exchange Web Services, ActiveSync, Default App Pool, etc). Any value that sustains greater than 0 should be investigated as this is a potential queue length limit hit for that particular app pool.
NOTE: Regarding any performance data, spikes can be normal. You should monitor this counter over time and look for sustained values above 0; if the value is consistently above 0, then there may be something to investigate, for example - has your environment exceeded the initial server scale? Or is a user/device mis-behaving? Etc…
In Exchange 2013, baseline performance is captured by default every 1 minute, and includes this counter.
The default location is C:\Program Files\Microsoft\Exchange Server\V15\Logging\Diagnostics\DailyPerformanceLogs.
For previous versions of Exchange (Exchange 2007 or 2010), or if you want to customize the interval or location of files in Exchange 2013, you can use ExPerfWiz to create a data collector set for you.
Thanks to Sainath Vijayaraghavan for reviewing and suggesting content.