Part 26 of 31 - Monitoring and Troubleshooting Windows Azure on the Cheap (31 Days of IaaS)
The best way to monitor and troubleshoot your Windows Azure platform in the cloud is to use the tools and portal that is provided to you as a Windows Azure subscriber.
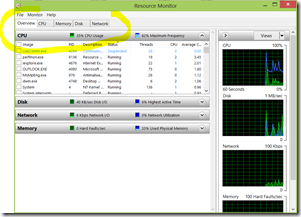
If you have a virtual machine running Windows Server 2008 R2 or Windows Server 2012, all of the standard OS monitoring tools are available, such as Resource Monitor and Performance Monitor, for remote monitoring scenarios (assuming that firewall endpoints are configured to pass the traffic).
If the virtual machine is running a web service, such as IIS, you can also deploy a custom health probe web page that can be used to monitor the health and availability of virtual machines in a load-balanced scenario.
If multiple virtual machines are connected together in the same cloud service, you can produce composite performance charts that compares CPU, Disk, Memory, Network utilization across virtual machines.
There are free monitoring “add-ons” in the Azure store, like ActiveCloud that provides from simple shared hosting and domains to extending services for the most advanced solutions like IaaS, clustering and high-availability, enterprise grade virtualization, CDN, SaaS, virtual desktops and more.
You can start by going into the portal tools by clicking the fly-out that looks like a down arrow V.
Double-click arrow facing down on the service item you want to monitor, like Demotest virtual machine below.
You can monitor the resources like CPU Percentage below and determine if the amount of CPU is adequate for your workload and adjust accordingly by adding more resources.
You can check your services workloads in your dashboard and monitor and troubleshoot any issues that arise or address them with online product support.
You can also adjust resources as you grow with your business. Check out the costs associated with adding resources through the PRICING portal.
When you are talking blob storage you can enable storage monitoring of Blobs on the CONFIGURE page. You can set GEO-REPLICATION to a Secondary Region and set monitoring for blobs, tables and queues.
You can also set logging for the blob storage concerning read, write and delete requests for Blobs, Tables and Queues.
There are many things you can check under the SUPPORT area inside your Windows Azure portal.
The SUPPORT portal contains online forums, service dashboard and technical/billing support.
The Stackoverflow and MSDN forums are excellent resources for support.
You will also want to make sure and check the datacenter cloud back-end systems and services through the service dashboard to ensure that they are up and running in normal mode.
You can open a Support ticket right through the portal itself by clicking on GET SUPPORT.
I’ve dealt with online support a couple of times on my usage and troubleshooting. They have been excellent to work with and will even call you back if you prefer.
You can also use the tools such as Windows Azure Diagnostics below.
Windows Azure Diagnostics enables you to collect diagnostic data from an application running in Windows Azure. You can use diagnostic data for debugging and troubleshooting, measuring performance, monitoring resource usage, traffic analysis and capacity planning, and auditing. After the diagnostic data is collected it can be transferred to a Windows Azure storage account for persistence. Transfers can either be scheduled or on-demand.
Try Windows Azure https://aka.ms/try-azure Get Started Now – (Free account requires a credit card but not charged)
Get your Microsoft Evaluation Products at https://aka.ms/msproducts
In case you missed any of the series here is a list to all of the articles: https://aka.ms/31azure

![clip_image002[5] clip_image002[5]](https://msdntnarchive.blob.core.windows.net/media/TNBlogsFS/prod.evol.blogs.technet.com/CommunityServer.Blogs.Components.WeblogFiles/00/00/00/44/49/metablogapi/2046.clip_image0025_thumb_6783D3A6.jpg)
![clip_image004[5] clip_image004[5]](https://msdntnarchive.blob.core.windows.net/media/TNBlogsFS/prod.evol.blogs.technet.com/CommunityServer.Blogs.Components.WeblogFiles/00/00/00/44/49/metablogapi/1050.clip_image0045_thumb_663F3AC7.jpg)
![clip_image006[5] clip_image006[5]](https://msdntnarchive.blob.core.windows.net/media/TNBlogsFS/prod.evol.blogs.technet.com/CommunityServer.Blogs.Components.WeblogFiles/00/00/00/44/49/metablogapi/5344.clip_image0065_thumb_4F9CEC80.jpg)
![clip_image008[5] clip_image008[5]](https://msdntnarchive.blob.core.windows.net/media/TNBlogsFS/prod.evol.blogs.technet.com/CommunityServer.Blogs.Components.WeblogFiles/00/00/00/44/49/metablogapi/3201.clip_image0085_thumb_5C2A999C.jpg)
![clip_image010[5] clip_image010[5]](https://msdntnarchive.blob.core.windows.net/media/TNBlogsFS/prod.evol.blogs.technet.com/CommunityServer.Blogs.Components.WeblogFiles/00/00/00/44/49/metablogapi/3223.clip_image0105_thumb_33ABB788.jpg)
![clip_image012[5] clip_image012[5]](https://msdntnarchive.blob.core.windows.net/media/TNBlogsFS/prod.evol.blogs.technet.com/CommunityServer.Blogs.Components.WeblogFiles/00/00/00/44/49/metablogapi/3716.clip_image0125_thumb_18FF1B6F.jpg)
![clip_image014[5] clip_image014[5]](https://msdntnarchive.blob.core.windows.net/media/TNBlogsFS/prod.evol.blogs.technet.com/CommunityServer.Blogs.Components.WeblogFiles/00/00/00/44/49/metablogapi/6835.clip_image0145_thumb_2997165D.jpg)
![clip_image016[5] clip_image016[5]](https://msdntnarchive.blob.core.windows.net/media/TNBlogsFS/prod.evol.blogs.technet.com/CommunityServer.Blogs.Components.WeblogFiles/00/00/00/44/49/metablogapi/6431.clip_image0165_thumb_042D22EF.jpg)
![clip_image018[5] clip_image018[5]](https://msdntnarchive.blob.core.windows.net/media/TNBlogsFS/prod.evol.blogs.technet.com/CommunityServer.Blogs.Components.WeblogFiles/00/00/00/44/49/metablogapi/3716.clip_image0185_thumb_6DF7079C.jpg)
![clip_image020[5] clip_image020[5]](https://msdntnarchive.blob.core.windows.net/media/TNBlogsFS/prod.evol.blogs.technet.com/CommunityServer.Blogs.Components.WeblogFiles/00/00/00/44/49/metablogapi/7002.clip_image0205_thumb_5A69A7FB.jpg)
![clip_image022[5] clip_image022[5]](https://msdntnarchive.blob.core.windows.net/media/TNBlogsFS/prod.evol.blogs.technet.com/CommunityServer.Blogs.Components.WeblogFiles/00/00/00/44/49/metablogapi/7024.clip_image0225_thumb_03FD732F.jpg)
![clip_image024[5] clip_image024[5]](https://msdntnarchive.blob.core.windows.net/media/TNBlogsFS/prod.evol.blogs.technet.com/CommunityServer.Blogs.Components.WeblogFiles/00/00/00/44/49/metablogapi/8407.clip_image0245_thumb_7E425988.jpg)
![clip_image026[5] clip_image026[5]](https://msdntnarchive.blob.core.windows.net/media/TNBlogsFS/prod.evol.blogs.technet.com/CommunityServer.Blogs.Components.WeblogFiles/00/00/00/44/49/metablogapi/0564.clip_image0265_thumb_1CAC9A72.jpg)
![clip_image028[5] clip_image028[5]](https://msdntnarchive.blob.core.windows.net/media/TNBlogsFS/prod.evol.blogs.technet.com/CommunityServer.Blogs.Components.WeblogFiles/00/00/00/44/49/metablogapi/3782.clip_image0285_2E1CFB4A.jpg)