Enhanced tracing for ASP debugging
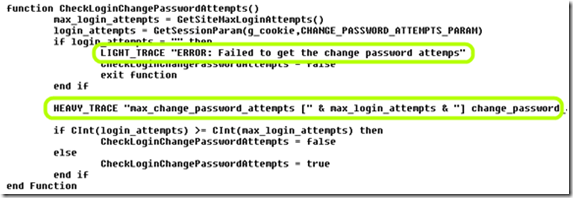
I’ve talked before about how to enable and read UAG’s traces, for advanced debugging and troubleshooting. However, this type of tracing does not cover the entire spectrum. If you ever looked at UAG’s ASP code, you might have noticed that the code has various “trace” commands all-around. For example:
These commands refer to some built-in tracing functions that are part of UAG’s code, and they are used extensively throughout UAG’s ASP pages. However, this data is not actually written to the trace when doing normal tracing. Enabling these may be a key ingredient in chasing down a problem, and also if you are customizing the default code for UAG. The functions that perform the tracing (“LIGHT_TRACE”, “MEDIUM_TRACE”, “HEAVY_TRACE” and “XHEAVY_TRACE”) are included by every ASP page that UAG uses, and are INCLUDED from the file <UAG Path>/Von/InternalSite/Inc/Trace.inc. This also means that you can use them for your own needs, when customizing or writing your own code to run within the UAG framework.
To enable tracing on UAG that includes the output of these functions, you need to edit the file mentioned above (trace.inc), and edit line no. 7 in it, which is set to “false” by default. Simply open the file with a text editor, and change the text to “true”:
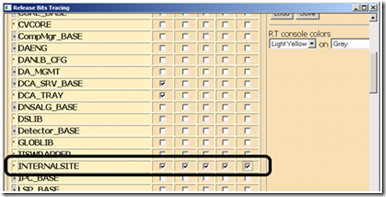
Note that normally, we ask UAG administrators NOT to change any of the default code files, but this is a rare exception to that rule. After editing and saving the file, use the standard tracing tool for UAG to collect your trace. If you are interested only in trace messages created by the trace commands in ASP, then simply enable tracing for just the “INTERNALSITE” component:
Note that the traces created by ASP pages will carry the keyword “whlcomtrace”. Like this:
From a debugging perspective, having to start, stop and decode a trace for every minor change can be tedious, so keep in mind that you can also embed “response.write” in your code, to get an immediate, on-screen output of information. In case the output is too fast to read, or done to pages that are not visible to the eye, you can use a tool such HTTPWatch or Fiddler to record the session from the client, and then view the page’s source to locate the output.
Another option at your disposal is the ASP object “FileSystemObject”, which you can use to dump text files with data directly to the UAG’s hard drive. For example, this code, put inside an ASP piece will create a text file on the computer’s drive with whatever you want to dump into it.
Lastly, another tip for performing tracing:
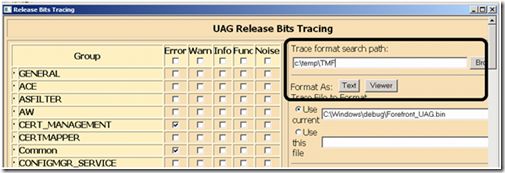
When you do collect a trace, one little convenience is placing the UAG TMF files on the UAG server itself, which allows you to decode the trace instantly. To do so, just paste the path of the TMF files, and use either the viewer or the text button to open the recent trace file.
Happy tracing!


