Troubleshooting High LSASS CPU Utilization on a Domain Controller (Part 1 of 2)
Hi, Ned here. Today I’m going to talk about troubleshooting Domain Controllers that are responding poorly due to high LSASS CPU utilization. I’ve split this article into two parts because there are actually two major forks that happen in this scenario:
· You find that the problem is coming from the network and affecting the DC remotely.
· You find that the problem is coming from the DC itself.
LSASS is the Local Security Authority Subsystem Service. It provides an interface for managing local security, domain authentication, and Active Directory processes. A domain controller’s main purpose in life is to leverage LSASS to provide services to principals in your Active Directory forest. So when LSASS isn’t happy, the DC isn’t happy.
The first step to any kind of high LSASS CPU troubleshooting is to identify what ‘high’ really means. For us in Microsoft DS Support, we typically consider sustained and repeated CPU utilization at 80% or higher to be trouble if there’s no baseline of comparison. Periodic spikes that last a few seconds aren’t consequential (after all, you want your money’s worth of that new Quad Core), but if it lasts for ten to fifteen minutes straight and repeats constantly you may start seeing other problems: slower or failing logons, replication failures, etc. For you as an administrator of an AD environment, ‘high’ may mean something else – for example, if you are baselining your systems with MOM 2005 or SCOM 2007you may have already determined that normal CPU load on your DC’s is 20%. Then when all the DC’s start showing 50% CPU, this is aberrant behavior and you want to find out why. So it’s not necessary for the utilization to reach some magic number, just for it to become abnormal compared to what you know it typically baselines.
The next step is determine the scope – is this happening to all DC’s or just ones in a particular physical or logical AD site? Is it just the PDC Emulator? This helps us focus our troubleshooting and data collection. If it’s just the PDCE can we temporarily move the role to another server (be careful about this if using external domain trusts that rely on static LMHOSTS entries)? If the utilization follows, the problem is potentially an older application using legacy domain API’s that were designed for NT4. Perhaps this application can be turned off, modified or updated. There could also be down-level legacy OS’s in the environment, such as NT4 workstations and they are overloading the PDCE. There are also components within AD that focus their attention on the PDCE as a matter of convenience (password chaining, DFS querying, etc). If you are only seeing the issue on the PDCE, examine Summary of "Piling On" Scenarios in Active Directory Domains.
The next step is to identify if the issue is coming from the network or on the DC itself. I’ll be frank here – 99.999% of the time the issue is going to come off box. If you temporarily pull the network cable from the DC and wait fifteen minutes, LSASS is nearly guaranteed to drop back down to ~1% (why 15 minutes? That’s above the connection timeout for most components and after that time the DC should have given up on trying to service any more requests that were already queued). If it doesn’t drop, we know the problem is local to this DC. So here’s where this blog forks:
You find that the problem is coming from the network and affecting the DC remotely. It’s not just the PDCE being affected.
We can take a layered approach to troubleshooting high LSASS coming from the network. This involves a couple of tools and methods:
· Windows Server 2003 Performance Advisor (SPA)
· Wireshark (formerly Ethereal) network analysis utility (note: Wireshark is not affiliated with or supported by Microsoft in any way. Wireshark is used by Microsoft Product Support for network trace analysis in certain scenarios like this one. We also use Netmon 3.1, NMCAP, Netcap, and the built-in Netmon 2.x Lite tools. This is in no way an endorsement of Wireshark.).
Server Performance Analyzer (SPA) can be useful for seeing snapshots of Domain Controller performance and getting some hints on what’s causing high CPU. While it’s easier to analyze than a network trace, it’s also more limited in what it can understand. It runs on the affected server, so if the CPU is so busy that the server isn’t really responsive it won’t be helpful. Let’s take a look at a machine which is seeing fairly high CPU, but where it’s still usable:
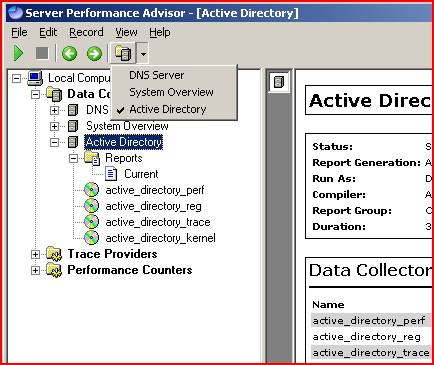
We’ve installed SPA, started it up and selected Active Directory for our Data Collector, like so:
We then execute the data collection which then runs for 15 minutes. This reads performance counters and other mechanisms in order to create us some reports.
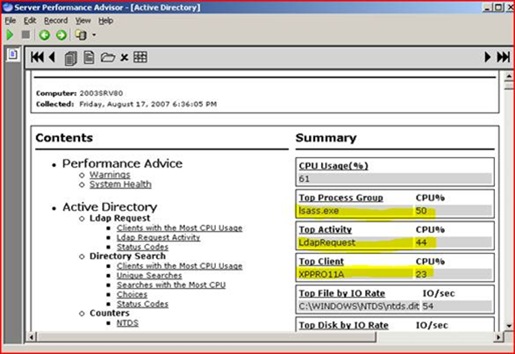
We open that current report and are greeted with some summary information. We can see here that overall CPU is at 61% and that most of the CPU time is against LSASS. We also see that it’s mainly LDAP requests eating up the processor, and that one particular remote machine is accounting for an abnormally large amount of it.
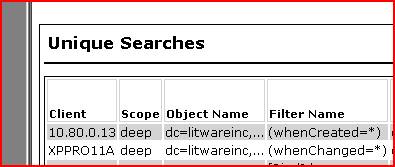
So we drill a little deeper into the details from SPA and look in the unique LDAP searches area. The two machines below are sending a deep query (i.e. it searches all subtrees from the base of our domain naming context) using some filters based on attributes of ‘whenCreated’ and ‘whenChanged’. Odd.
We’re still not convinced though – after all, SPA takes short snapshots and it really focuses on LDAP communication. What if it happened to capture a behavioral red herring? Let’s get some confirmation.
We start by getting some 100MB full frame network captures. We can use the built-in Netmon Lite tool, use NETCAPfrom the Windows Support Tools, or anything you feel comfortable with. Doing less than 100MB means our sample will be too small; doing more than 100MB means that the trace filtering becomes unwieldy. Getting more than one is advisable.
So we have our CAP file and we open it up in Wireshark. We click ‘Statistics’ then ‘Conversations’ . This executes a built in filter that generates a TSV-formatted output (which you can throw into Excel and graph if you want to be fancy for upper management). Hit the IPv4 tab and we see:
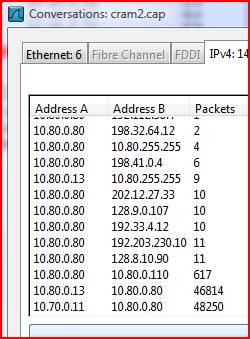
Whoa, very interesting. 10.80.0.13 and 10.70.0.11 seem to be involved in two massive conversations with our DC, and everything else looks pretty quiet. Looking back at our SPA we see that .13 address listed and if we NSLOOKUP the 11 address we find it’s the XPPRO11A machine. I think we’re on to something here.
We set a filter for the 10.80.0.13 machine in our CAP file and set it to only care about LDAP traffic, like so:
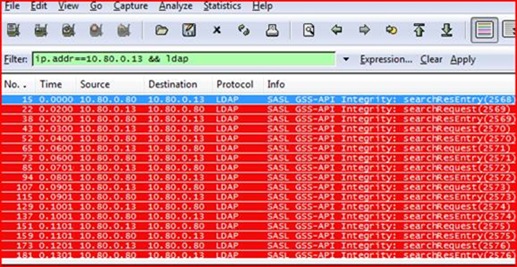
We can see that the 10.80.0.13 machine is making constant LDAP requests against our DC. That unto itself isn’t very normal – a Windows machine doesn’t typically send a barrage of queries all day, it sends small spurts to do specific things like logon, lookup a group membership, or process group policy. What exactly is this thing doing? Let’s look at the details of one of these requests in Wireshark:
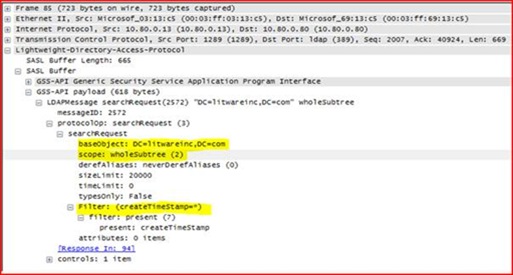
Well, it’s definitely the same thing we saw in SPA. We’re connecting to the base of the domain Litewareinc.com, and we’re searching for every single object’s create time stamp. We know that we have 100,000 users, 100,000 groups, and 100,000 computers in this domain, and using such a wide open query is going to be expensive for LSASS to process. But it still seems that we should be able to handle this? What makes this attribute cost us so much processing?
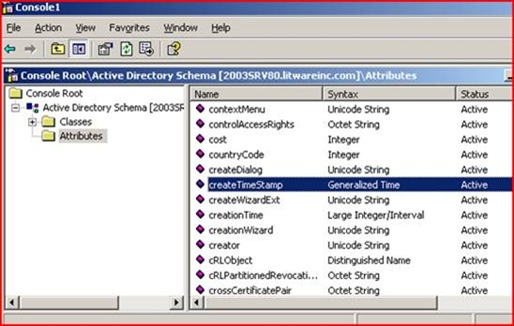
We run regsvr32 schmmgmt.dll in order to gain access to the Schema Management snap-in, then run MMC.EXE and add Active Directory Schema. Under the Attributes node we poke around and find createTimeStamp.
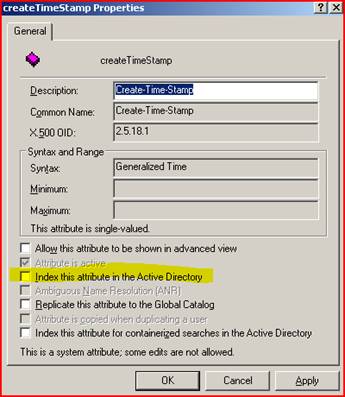
Well isn’t that a kick in the teeth – this attribute isn’t indexed by default! No wonder it’s running so painfully. Luckily DC’s cache frequently used queries or we’d be in even worse shape with disk IO. We don’t want to just go willy-nilly adding indexes in Active Directory as that can have its own set of memory implications. So we have a quick chat with the owner of those machines and he admits that they recently changed their custom LDAP application yesterday (when the problem started!). It was supposed to be getting back some specific information about user account creation but it had a bug and it was asking about every single object in Active Directory. They change their app and everything returns to normal – high fives for the good guys in Server Administration.
So today we learned about troubleshooting high LSASS CPU processing from a remote source. Next time we will diagnose a machine that’s having problems even after we pull it off the network. Stay tuned.
Notes:
Read this excellent post on SPAfor more info on that tool.
Read this write-upon query inefficiency. This is what you give to that LDAP developer that was beating up your DC’s!
LSASS memory utilization is an entirely different story. The JET database used by Domain Controllers is highly optimized for read operations, and consequently LSASS tries to allocate as much virtual memory through caching as it possibly can to make queries fast (and deallocates that memory if requested by other applications). This is why we recommend that whenever possible, a DC’s role should only be a DC – not also a file server, a SQL server, and Exchange server, an ISA box, and the rest. While this isn’t always possible, it’s our best practice advice. For more, read: Memory usage by the Lsass.exe process on domain controllers that are running Windows Server 2003 or Windows 2000 Server
For Windows 2000 we have an older SPA-like tool called ADPERF, but it’s only available if you open a support case with us.
For part 2, go here.
- Ned Pyle