How to Setup a Live Debug Using Physical Machines
For this example I am using a Windows Server 2012 Physical machine that will be used to debug a problem machine. I will setup a live Debug session with a Windows 7 sp1 physical machine.
Win2012Debugger (Host) - This is the physical machine that will be used to do the debug
Win7 client (Target) - This is the physical client machine being debugged
The problem production machine is referred to as the Target Computer and the Debugging Tools for Windows are installed on the Host computer. The machines are attached with either a null-modem cable, 1394 cable, a special USB cable, or an Ethernet cable (network debugging was added in Windows 8). In this example the serial debugging is outlined because this is the most common technique
Configuring the physical Windows Server 2012 (Host) machine:
1. Install the debug tools
https://msdn.microsoft.com/en-us/windows/hardware/hh852363
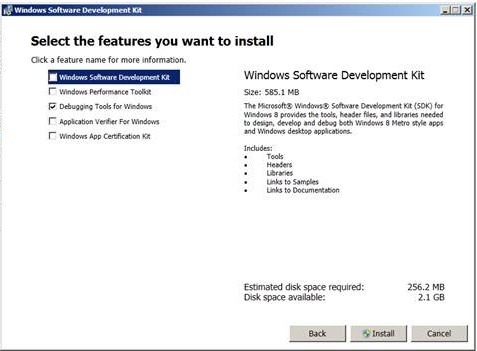
Click Next until you see the Select the features you want to install screen.
Select only the option named Debugging Tools for Windows and click the Install button. I typically install the tools to a directory named C:\debugger
![clip_image001[4]](https://msdntnarchive.blob.core.windows.net/media/TNBlogsFS/prod.evol.blogs.technet.com/CommunityServer.Blogs.Components.WeblogFiles/00/00/00/59/75/metablogapi/2816.clip_image0014_47F185E3.jpg "clip_image001[4]")
2. Open Windbg with administrative privileges.
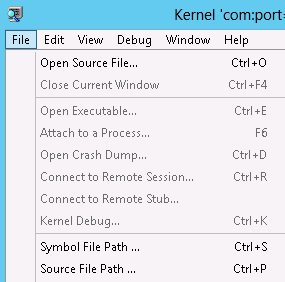
3. Configure the symbol path
a. From within windbg, click on file, Symbol File Path
![clip_image002[4]](https://msdntnarchive.blob.core.windows.net/media/TNBlogsFS/prod.evol.blogs.technet.com/CommunityServer.Blogs.Components.WeblogFiles/00/00/00/59/75/metablogapi/3252.clip_image0024_17E73462.png "clip_image002[4]")
b. In the Symbol Search Path insert the following:
.sympath SRV*f:\localsymbols*https://msdl.microsoft.com/download/symbols
(This will allow the debugger to use the public symbols that are available online)
Configuring the physical Windows 7 client (Target) machine:
1. Logon to the Windows 7 client that you are going to debug. If the machine is not booting you can run the commands from Winre or Winpe.
2. Open an administrative command prompt and enable debugging by running the following command:
Bcdedit /debug on
If you are running the command from Winre or Winpe it would be
Bcdedit /set {default} debug on
3. Configure the debugger to use the COM port specified by running the following command:
Bcdedit /dbgsettings Serial Debugport:1 baudrate:115200
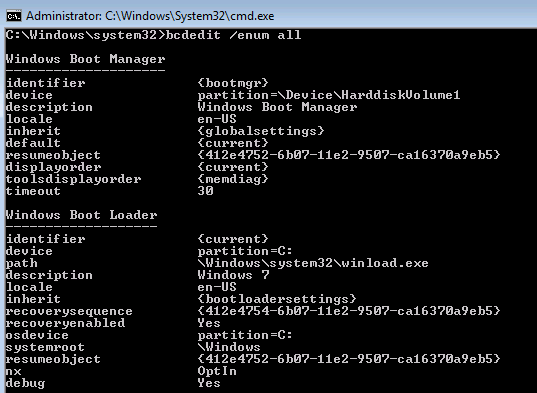
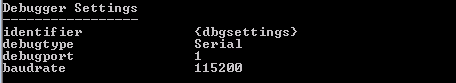
4. You can check these settings by running bcdedit /enum all
You can see in the below diagrams that under Windows Boot Loader, debug is set to yes, and the debug settings reflect the last bcd command.
![clip_image003[4]](https://msdntnarchive.blob.core.windows.net/media/TNBlogsFS/prod.evol.blogs.technet.com/CommunityServer.Blogs.Components.WeblogFiles/00/00/00/59/75/metablogapi/1134.clip_image0034_6B5E047B.png "clip_image003[4]")
![clip_image004[4]](https://msdntnarchive.blob.core.windows.net/media/TNBlogsFS/prod.evol.blogs.technet.com/CommunityServer.Blogs.Components.WeblogFiles/00/00/00/59/75/metablogapi/0488.clip_image0044_22C415AA.png "clip_image004[4]")
5. Restart the Windows 7 client VM
Serial Connection Setup:
A null-modem cable is a serial cable used to send data between two serial ports and it can be cheaply purchased at most electronics stores. Be aware these are different from standard serial cables because the transmit and receive lines are cross linked.
Plug the null-modem cable into a serial port on each of the computers. The serial port on the target computer must be built into the system, add on components such as PCI cards will not work for serial debugging on the target computer.
Remote Debugging:
1. Launch windbg with administrative privileges.
2. On the File menu, choose Kernel Debug.
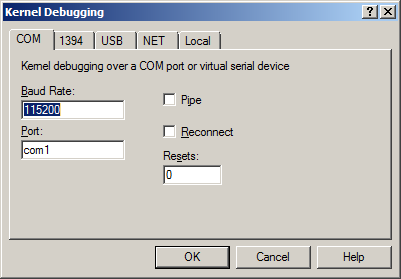
3. In the Kernel Debugging dialog box, open the COM tab.
4. In the Baud rate box, enter the same rate you selected for the Target Machine in the steps above. This is usually 115200.
5. In the Port box, enter COMx where x is the COM port connected to the null modem cable on this computer. In my example I plugged my null modem cable to com port 1 so I typed com1 in the field.
a. It is not necessary to use the same port number on both the target and the host. For example, it is possible to use com1 on the target and com2 on the host.
![clip_image005[4]](https://msdntnarchive.blob.core.windows.net/media/TNBlogsFS/prod.evol.blogs.technet.com/CommunityServer.Blogs.Components.WeblogFiles/00/00/00/59/75/metablogapi/7444.clip_image0054_7060422A.png "clip_image005[4]")
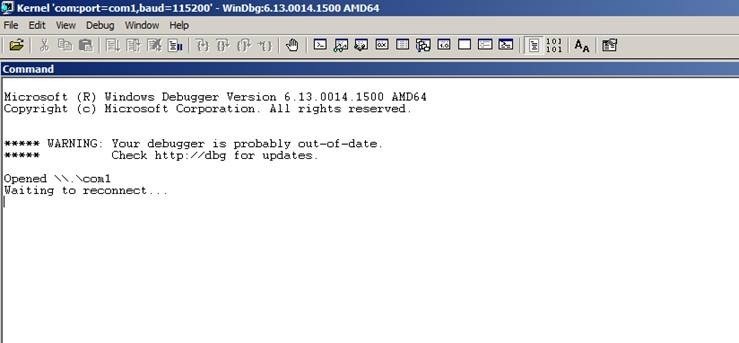
6. Click OK and you’ll receive a message indicating the Host computer is waiting to connect.
![clip_image006[4]](https://msdntnarchive.blob.core.windows.net/media/TNBlogsFS/prod.evol.blogs.technet.com/CommunityServer.Blogs.Components.WeblogFiles/00/00/00/59/75/metablogapi/3603.clip_image0064_7A453395.jpg "clip_image006[4]")
7. From the Debug menu select Break will cause the debugger to break into the target machine and give you the opportunity to debug your ailing production server.
8. You can test the debug connection by running the !process 0 0 command. This will show you the running processes on the target Operating System.
Jim Collins
Senior Support Escalation Engineer
Microsoft Commercial Technical Support