Understanding the Cluster Debug Log in 2008
One of the major changes from 2003 to 2008 is the way we handle logging of cluster debug events. I thought I’d do a quick write-up on how cluster debug logging works in 2008.
In Windows 2003 Failover Clustering, the cluster service on each node constantly writes to a live debug output file. These files are located in the %SystemRoot%\Cluster folder on each node in the cluster and the name of the file is CLUSTER.LOG. The cluster log is local and specific to each node’s cluster service. Each node has a unique log file that represents its views and actions. This file is in a basic text format and can be easily viewed with Word, Notepad, etc.
In Windows Server 2008, a change was made to make the cluster debug logging mechanism more in line with how the rest of Windows handles event logging. The Win 2003 legacy CLUSTER.LOG text file no longer exists. In Win 2008 the cluster log is handled by the Windows Event Tracing (ETW) process. This is the same logging infrastructure that handles events for other aspects you are already well familiar with, such as the System or Application Event logs you view in Event Viewer.
For more information on the topic of Windows Event Tracing, see the following MSDN articles:
Improve Debugging And Performance Tuning With ETW
How to Generate a Cluster Log
First we need to look at the cluster logs in some user friendly format. You can run the following commands to generate a text readable version of the ETL files. We’ll talk more about ETL files in a bit. The trace sessions are dumped into a text file that looks very similar to the legacy CLUSTER.LOG
If you are running Windows Server 2008, you can use the ‘cluster.exe’ command line . If you are running Windows Server 2008 R2, you can use either ‘cluster.exe’ command line or the cluster PowerShell cmdlets.
Command Line
c:\>cluster log /gen
Some useful switches for ‘cluster log /gen’ are:
| Switch | Effect |
| c:\>cluster log /gen /COPY:”directory” | Dumps the logs on all nodes in the entire cluster to a single directory |
| c:\>cluster log /gen /SPAN:min | Just dump the last X minutes of the log |
| c:\>cluster log /gen /NODE:”node-name” | Useful when the ClusSvc is down to dump a specific node’s logs |
For more detailed information on the ‘cluster log /gen’ command, see the TechNet article here.
Powershell
C:\PS> Get-ClusterLog
Some useful switches for ‘Get-ClusterLog’ are:
| Switch | Effect |
| C:\PS> Get-ClusterLog –Destination | Dumps the logs on all nodes in the entire cluster to a single directory |
| C:\PS> Get-ClusterLog –TimeSpan | Just dump the last X minutes of the log |
| C:\PS> Get-ClusterLog –Node | Useful when the ClusSvc is down to dump a specific node’s logs |
For more detailed information on the ‘Get-ClusterLog’ cmdlet, see the TechNet article here.
Failover Cluster Tracing Session
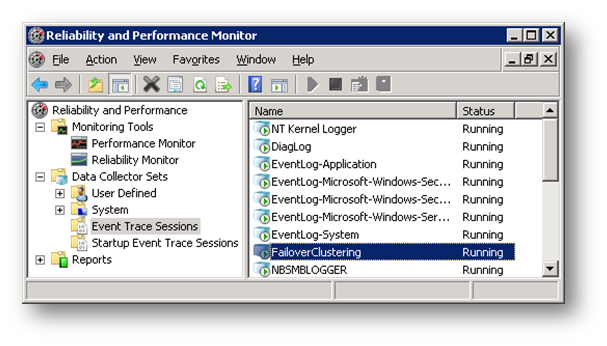
You can see the FailoverClustering ETW trace session (Microsoft-Windows-FailoverClustering) in ‘Reliability and Performance Monitor’ under ‘Data Collector Sets’, ‘Event Trace Sessions.
Cluster event tracing is enabled by default when you first configure the cluster and start the cluster service. The log files are stored in:
%WinDir%\System32\winevt\logs\
The log files are stored in an *.etl format.
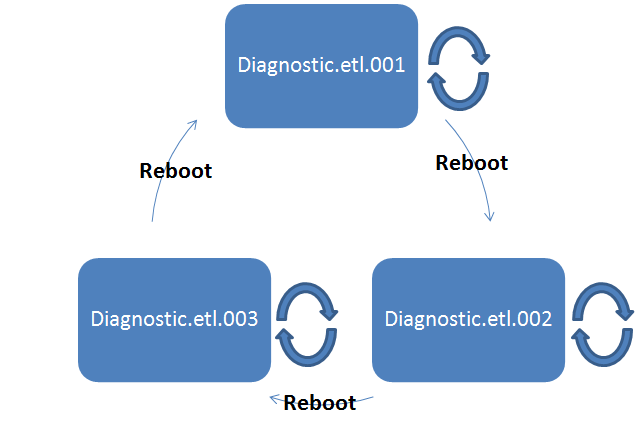
Every time a server is rebooted, we take the previous *.etl file and append it with a 00X suffix
By default, we keep the most recent three ETL files. Only one of these files is the active or “live” log at any given time.
Format in Windows Server 2008
ClusterLog.etl.001
ClusterLog.etl.002
ClusterLog.etl.003
Format in Windows Server 2008 R2
Microsoft-Windows-FailoverClustering Diagnostic.etl.001
Microsoft-Windows-FailoverClustering Diagnostic.etl.002
Microsoft-Windows-FailoverClustering Diagnostic.etl.003
The default size of these logs is 100MB each. Later in this post, I’ll explain how to determine if this size is adequate for your environment.
The important thing to understand about the cluster logs is we use a circular logging mechanism. Since the logs are a finite 100MB in size, once we reach that limit, events from the beginning of the current or “live” ETL log will be truncated to make room for events at the end of the log.
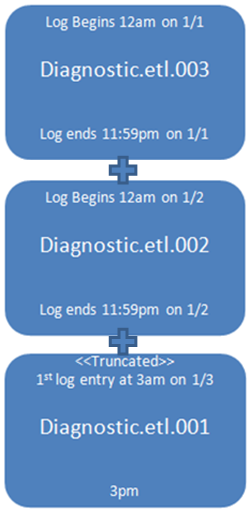
Here’s an example of the timeframes captured in a series of ETL files.
In this example, every night the server is rebooted at midnight. The three most recent ETL logs would look like this:
REBOOT
REBOOT
The ETL.001 file is the active file being used by the live cluster service to write debug entries. Let’s say there were many entries being written to the current trace session file and we hit the 100MB limit at 3pm. At that point, events from 12am to 3am were truncated to make room for additional entries in the log. At that point, the ETL.001 log would look like this:
Now I want to view the cluster logs in some text readable format so I run either the ‘cluster log /gen’ command or the ‘Get-ClusterLog’ cmdlet
These commands take all the ETL.00X files and “glues” them together in the order they were created to make one contiguous text file.
<- LIVE TRACE SESSION
The file that gets created is located in \%WinDir%\Cluster\Reports\ and is called CLUSTER.LOG
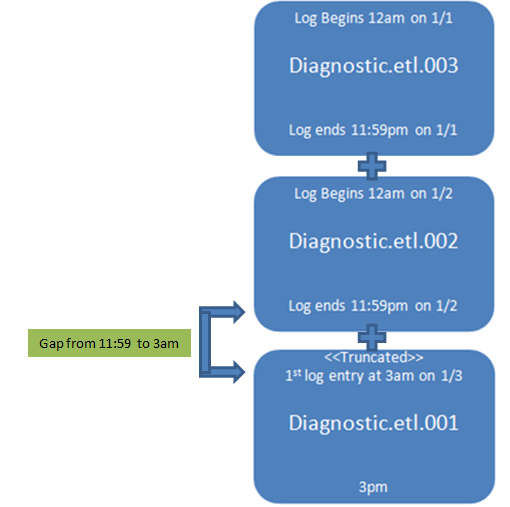
If you were looking at the debug entries in the CLUSTER.LOG file, you might notice that since we glued all three logs together, there is an apparent gap in the CLUSTER.LOG from 11:59pm on 1/2 to 3am on 1/3. The assumption may be that either there is information missing during that time or there was nothing being logged. The missing time is not in and of itself a problem, just a side effect of concatenating all three logs together.
How Large Should I Set My Cluster Log Size?
So now that you understand why there may be “gaps” in the cluster debug log, let’s discuss how this relates to understanding how large your cluster log size should be. The first thing you need to determine is “How much time is covered in each ETL file?”. If you were looking at the CLUSTER.LOG text file from the above examples, you could see that the most recent ETL.001 file contained about 12 hours of data before it was truncated. The other ETL files contain about 24 hours of data. When we are talking about the cluster log size, we are ONLY talking about the live ETL trace session.
The amount of data written to the ETL files is very dependent on what the cluster is doing. If the cluster is idle, there may be minimal cluster debug logging, if the cluster is recovering from a failure scenario, the logging will be very verbose. The more data being written to the ETL file, the sooner it will get truncated. There’s no one “recommended” value for the size of the cluster log that will fit everyone.
Since the default cluster log size in Windows Server 2008 is 100MB, the above example shows that 100MB ETL file covers about a 12-24 hour timeframe. This means if I am troubleshooting a cluster issue, I have 12 hours from the failure to generate a cluster log or risk information being truncated. If it may not be feasible to generate a cluster log that soon after a failure, you should consider increasing the size of the cluster log. If you changed the size of the cluster log to 400MB, you are accounting for the need to have at least 2 days (12 hours X 4) of data in the live ETL file.
Why Should I Care About All This?
While reading cluster logs may not be something you generally do in your leisure time, it’s a critical log Microsoft Support uses to troubleshoot cluster issues. If there’s any other message I could convey here it’s that in order for us to do a good job of supporting our customers, we need to have the data available. We often get customers who open a case to try and figure out why their cluster had problems and those problems occurred over a week ago. As hard of a message it is to deliver, without the complete cluster log, root cause analysis becomes extremely difficult. If you intend to open up a support case with Microsoft, keep the following in mind.
- The sooner after the failure we can capture the cluster logs, the better. The longer you wait to open a case and have us collect diagnostic information, the greater chance the cluster log will truncate the timeframe we need.
- If you can’t open a case right away, at least run the ‘cluster log /gen’ or the ‘Get-ClusterLog’ command and save off the cluster log files for when you do have a chance to open a case.
- It is generally recommended that your CLUSTER.LOG have at least 72 hours worth of continuous data retention. This is so that if you have a failure occur after you went home on Friday, you still have the data you need to troubleshoot the issue on Monday morning.
How To Change the Cluster Log Size
Changing the default cluster log size is fairly straightforward.
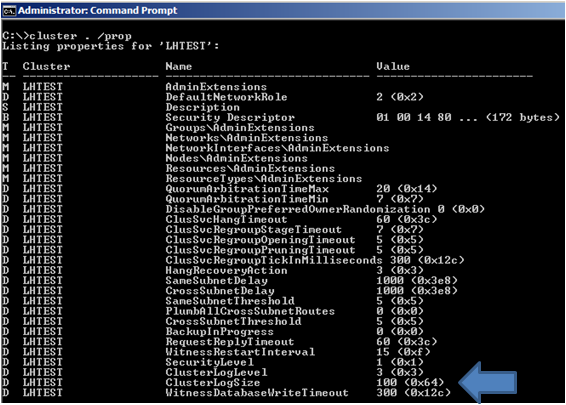
First, open an elevated command prompt and type the following:
C:\>cluster /prop
This will output the current properties of the cluster.
To change the cluster log size, open an elevated command prompt and type the command:
Powershell
C:\PS>Set-ClusterLog –Size X
Command Line
c:\>cluster log /Size:X
Where X is the size you want to set in MB. Note in the above screenshot, the default is 100.
How to Change the Detail Verbosity of the Cluster Log
In the above screenshot, the default cluster log level (ClusterLogLevel) is 3. Generally, you shouldn’t need to change the default level unless directed by a Microsoft Support Professional. Using debug level ‘5’ will have a performance impact on the server.
Level |
Error |
Warning |
Info |
Verbose |
Debug |
0 (Disabled) |
|
|
|
|
|
1 |
X |
|
|
|
|
2 |
X |
X |
|
|
|
3 (Default) |
X |
X |
X |
|
|
4 |
X |
X |
X |
X |
|
5 |
X |
X |
X |
X |
X |
To change the cluster log level, open an elevated command prompt and type the command:
Powershell
C:\PS>Set-ClusterLog –Level X
Command Line
c:\>cluster log /Level:X
Where X is the desired log level.
Hope you found this information useful.
Jeff Hughes
Senior Support Escalation Engineer
Microsoft Enterprise Platforms Support
