Operations Manager 101: How do I run a report for a performance counter that Operations Manager is collecting?
Note this is part of a System Center 2016 – Operations Manager and Operations Management Suite (OMS) 101 Series: https://aka.ms/101
Note: This exercise assumes that Operations Manager reporting is already installed and that a Performance Collection Rule already exists (either in an imported management pack or created in the authoring space in a custom management pack) which is collecting the desired data.
The first step will illustrate how to create an 'All Performance' view which shows all the Performance data that is currently being collected. This only needs to be done once and is used as a reference as to which counters and rules are available.
If a new performance collection rule is created or a disabled one is enabled for the purposes of seeing the performance data in a report, the data will not be available in reports until an hour later because the data is aggregated on an hourly cycle. It is the aggregated data that is displayed in the out of the box reports.
The steps below only need to be followed once to create a report. Once the report is created with all the required parameters, objects etc, it can be saved to authored reports (by publishing it) or saved to 'favorite reports' or to a Management Pack, and then be executed, without having to carry out the following steps each time the report is ran. IT can also be scheduled to be emailed or copied to a file share.
This document uses the example of creating a performance report displaying the performance counter SQL Server: SQL Statistics and Counter –Batch Requests /Sec. This data is collected by the Rule – 'Contoso Performance Collection Rule - SQL Server: Statistics\Batch Requests/sec' which is targeted to 'SQL Serve 2016 DB Engine'
Outline of Steps (Fully Detailed Steps Commence on Next Page)
1) Create an 'All' Performance View in My Workspace
2) Identify the rule and target name(s) for the required Performance Counter
3) Open the Generic Performance Report
4) Add the Required Chart and Series lines
5) Add an individual object to the first series line:
6) Add an individual object to any additional series lines:
7) Add the appropriate rule to the first series line
8) Add the appropriate rule to any additional series lines
9) Click OK in the settings dialog to confirm the settings.
10) Change the From value to a start time in the past, for instance use a previous day in the week.
11) Click Run
Detailed Steps
- Create an 'All Performance' View in My Workspace using the steps in https://aka.ms/scom101checkperf and use the 'Look for' box to find the appropriate rule / counter / object that you want to create a performance report for.
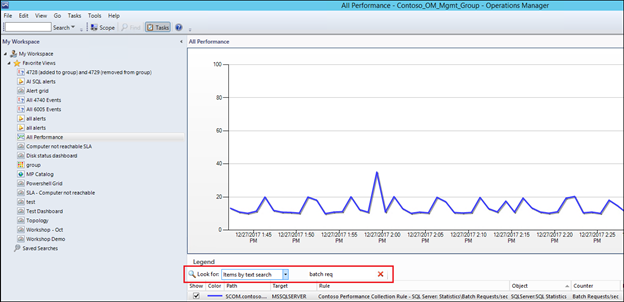
NOTE: in this example, we will use the Object SQL Server:SQL Statistics and the Counter 'Batch Requests/sec
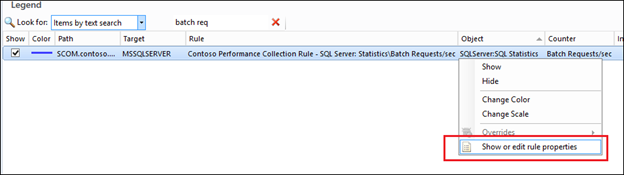
c) Right click the appropriate line and click 'Show or Edit Rule properties':
c) Note the 'Rule Target' and 'Rule Name' in the rule properties.
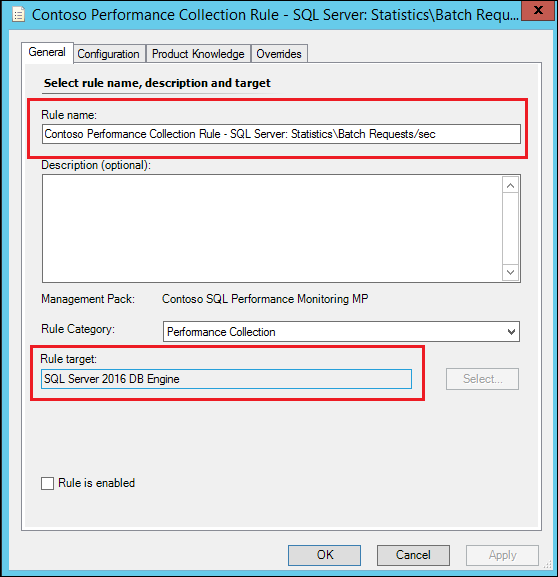
In this example:
Rule Name – Contoso Performance Collection Rule - SQL Server: Statistics\Batch Requests/sec
Rule Target – SQL Server 2016 DB Engine
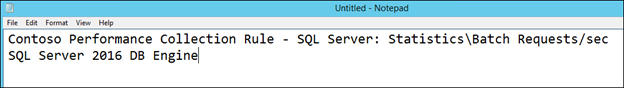
NOTE: I will typically copy these to a notepad file so I have them handy for later:
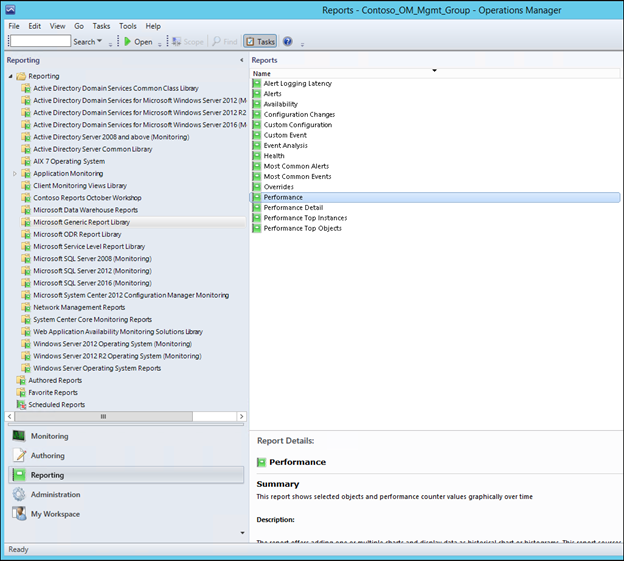
3) Open the Generic Performance Report
a) Click the reporting space and 'Microsoft Generic Reports Library' on the left
b) Double Click 'Performance'
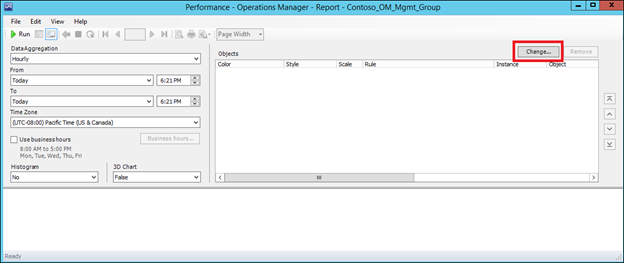
4) Add the Required Chart and Series lines
a) Click the 'Change' button near the top right of the window
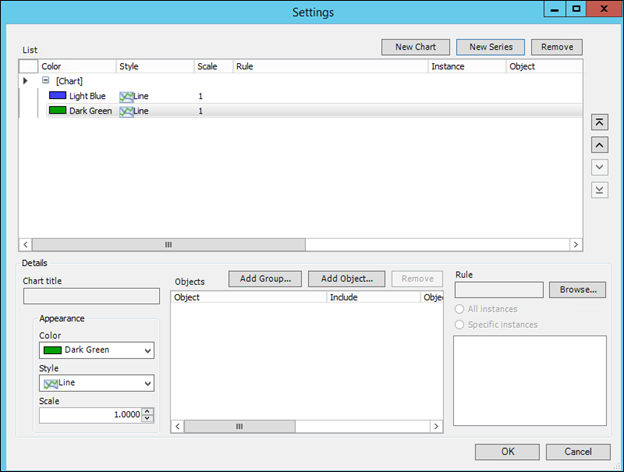
b) In the settings dialog box, click the new chart button
c) Click the New Series button one or more times depending on how many instances you would like your graph to show. If you will be adding an object such as SQL Server: Statistics\Batch Requests/sec for 15 different SQL Server DB Engines , you would need to add 15 Series lines.
NOTE: In the example, I will add 2 SQL Server 2016 DB Engines so I click New Series twice:
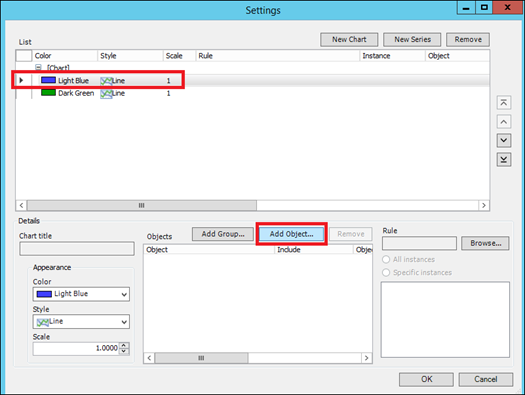
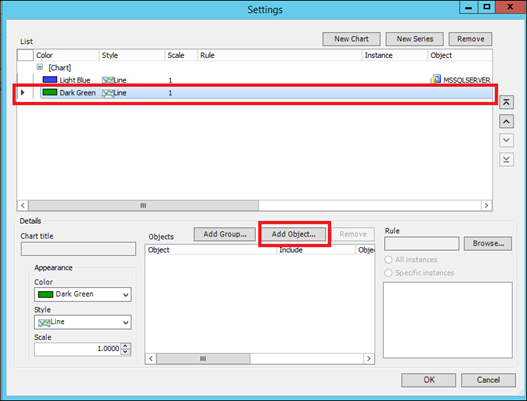
5) Add an individual object to the first series line:
a) Click on the first series and click Add Object
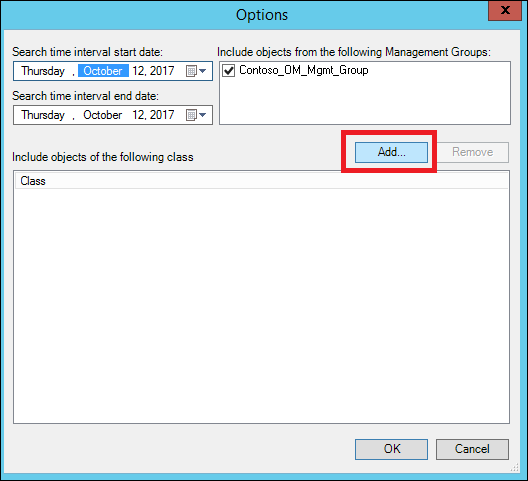
b) Click the Options button:
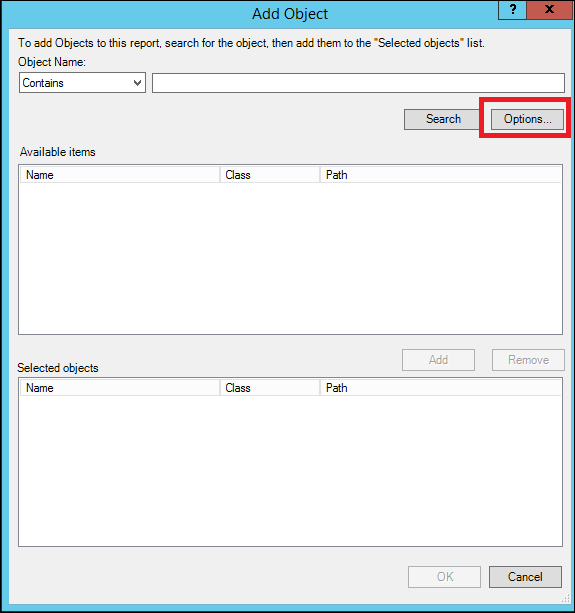
c) Click the Add button:

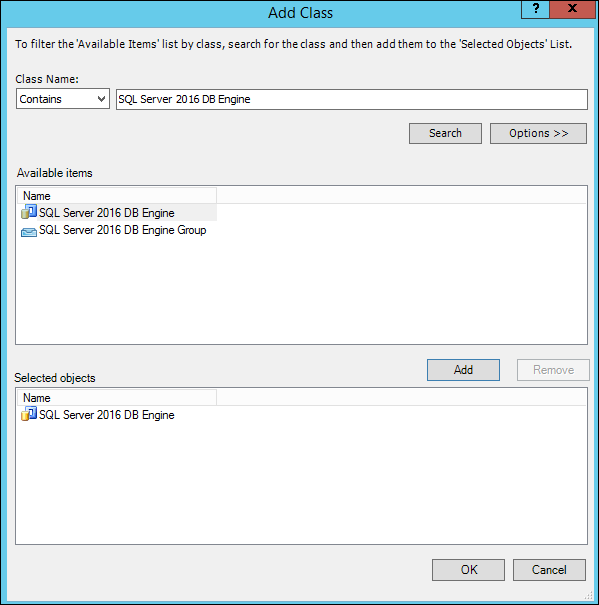
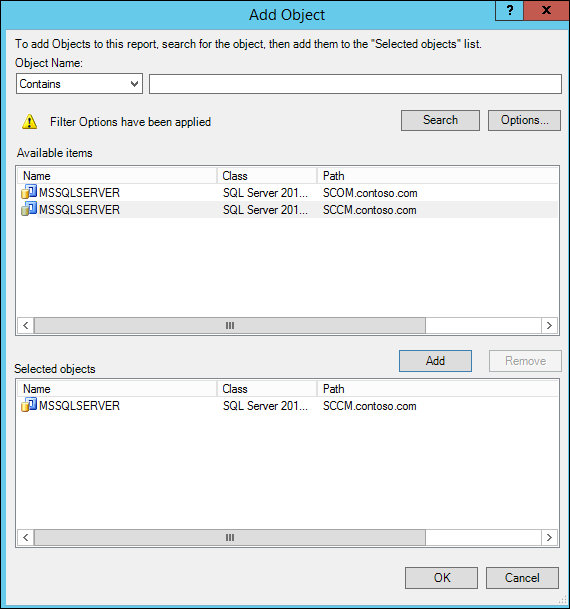
d) Type in all or part of the class name that you noted in Step 2, Search for it, click Add and then click OK:
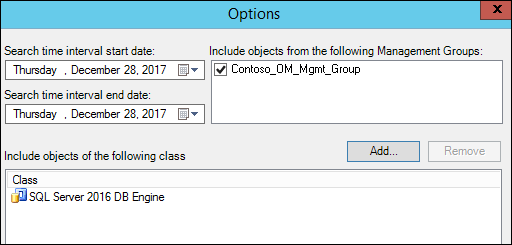
e) Click Ok in the Options dialog:
f) With the Filter applied, click Search and all instances of the selected object should be returned:
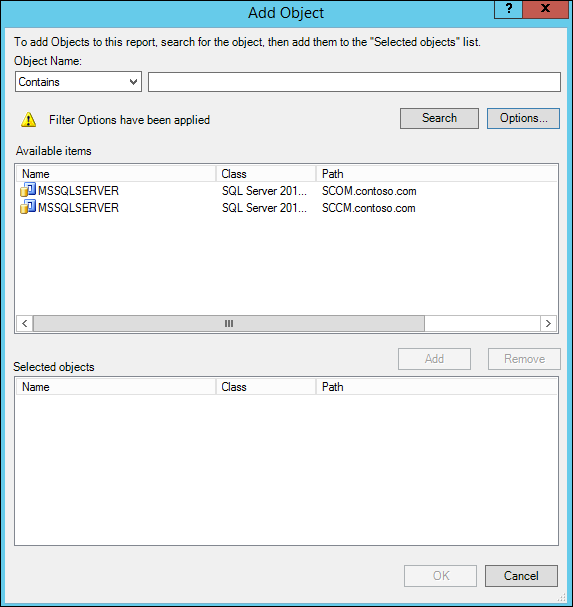
g) Pick ONE instance , Add One to the Selected Objects and click OK (DO NOT SELECT MULTIPLE!)
NOTE: Do not pick multiple instances. If you wish to add more than 2 instances (for instance 10 SQL Servers) you will need to add 10 series lines (using the new series button) and then add an individual instance to each series using steps Xx, Xx and X.
5) Add an individual object to the second series line
a) Click on the second series and click Add Object
b) Click the Options button:

c) Click the Add button:
d) Type in all or part of the class name that you noted in Step 2, Search for it, click Add and then click OK:

e) Click Ok in the Options dialog:

f) With the Filter applied, click Search and all instances of the selected object should be returned:

g) Pick ONE instance , Add One to the Selected Objects and click OK (DO NOT SLEECT MULTIPLE!)
If you have additional lines in the chart, repeat these steps until each line (series) of the chart is associated with an object
7) Add the appropriate rule to the first series line
a) If not already selected, click the first series line that was added under the chart header
b) Click the Browse button next to Rule on the right-hand side of the Settings Dialog:
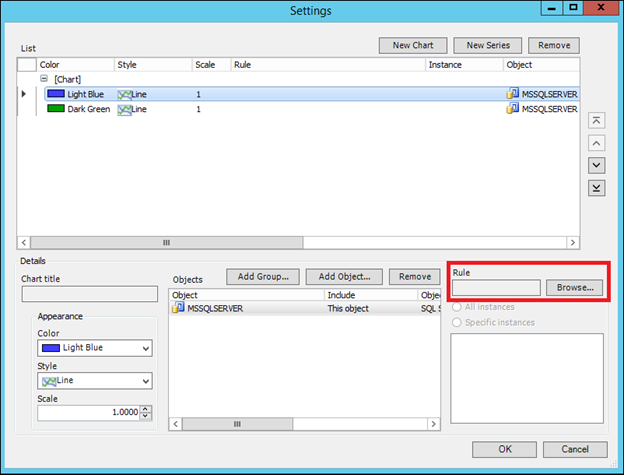
c) Leave the default 'Search by Name' Selected and in the search box, type part or the entire rule name noted in step 2 and click search:
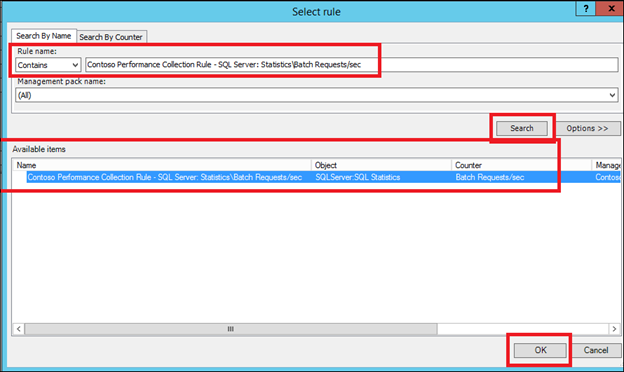
Select the appropriate rule and click OK.
Repeat Steps 7abc for any additional series, until each has a rule and object assigned.
When finished it should look something like this:
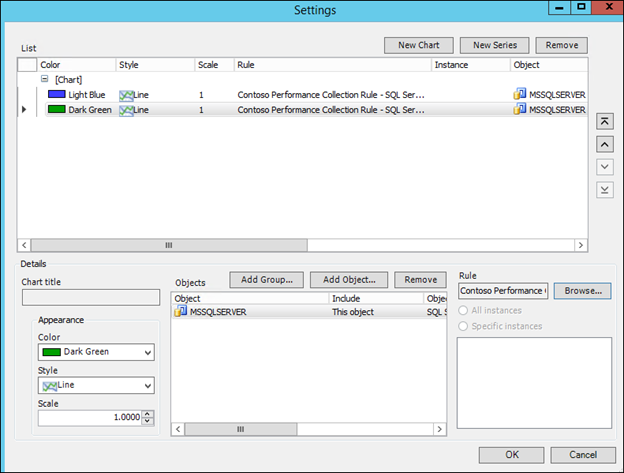
NOTE: although the rule name is cached and you will not need to search for it if using the same rule, you will need to search for the object type again, apply the filter, search for instances and then add the instance.
8) Click OK in the settings dialog to confirm the settings.
9) Change the From value to a start time in the past, for instance here I chose Advanced and configured Today minus 7 days in the From field:
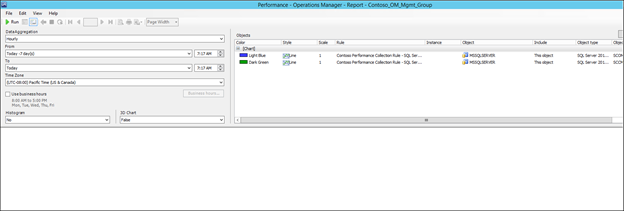
11) Click Run
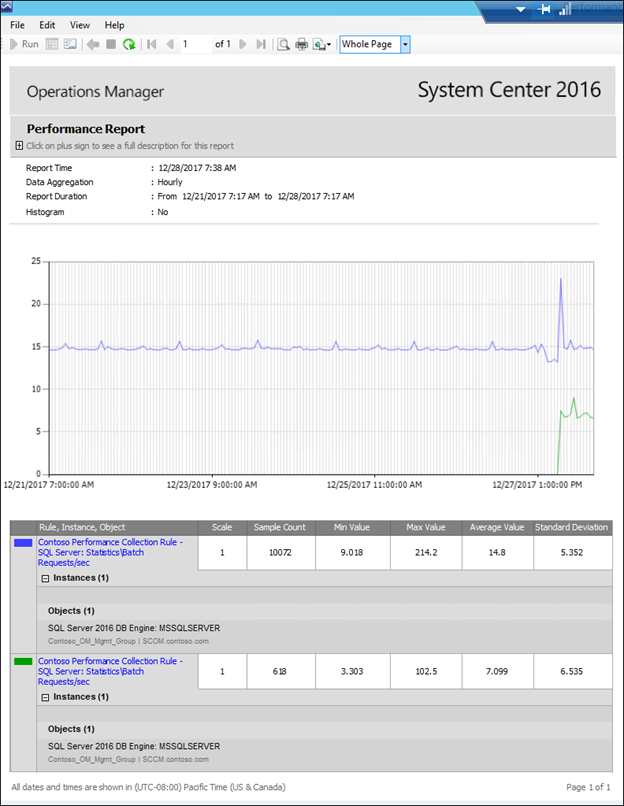
This was the report output using my example:
TIPS:
1) You can click the 'Show or Hide Parameter button' to bring back the parameters and modify the report settings. Access the settings dialog using the Change button.
2) Once the report appears, you can use the File menu to perform one of the following options which will remember the way in which you configured the report, allowing it to be re-ran by simply double clicking it:
Save to favorites – This will save the report to the 'Favorite Reports' node which is user-profile specific so the report will only be seen by the user who publishes it
Publish – This will save the report to the 'Authored Reports' node which is user-profile specific so the report will only be seen by the user who publishes it
Save to Management Pack – Will allow you to specify an existing management pack or create a new one to store the report in. This will create a new Folder under the reporting tree in the reporting space.
Schedule will enable the ability to copy the report to a file share, or email it on a specified schedule. To enable email functionality, be sure to add the email server and address in Reporting Services Configuration Manager on the SQL Server Reporting Server that is being used in your System Center Operations Manager environment.
NOTE: Any comments and feedback greatly appreciated if you found this post helpful or have any corrections / suggestions. Cheers, Antoni