Operations Manager 101: How do I create a performance monitor to monitor if a performance counter sample exceeds a threshold?
Note this is part of a System Center 2016 – Operations Manager and Operations Management Suite (OMS) 101 Series: https://aka.ms/101
Example: Create a monitor so I am alerted when CPU exceeds 80% usage on a server:
NOTE: there is already a monitor called 'Total CPU Utilization Percentage that monitors both Processor Information\% Processor Time\_Total and the System\Processor Queue Length (More about that here - https://blogs.technet.microsoft.com/kevinholman/2017/05/13/how-does-cpu-monitoring-work-in-the-windows-server-2016-management-pack/ ) The monitor created in the following steps monitors just CPU %Processor Time Total
NOTE: When working with a threshold for monitoring, it is necessary to create a monitor, rather than a rule. The key difference between a monitor and a rule, is that a monitor is state-based which means it will actually change the state of an object to red (critical), yellow (warning) or green (healthy) in the state views. A rule is targeted to an object, but can not change the health state of an object (in the event of a threshold been exceeded for example).
Also a performance collection rule collects samples on a designated interval and stores these in the DB, but does not create alerts based on this collected data. Instead the data is viewed via performance views and reports.
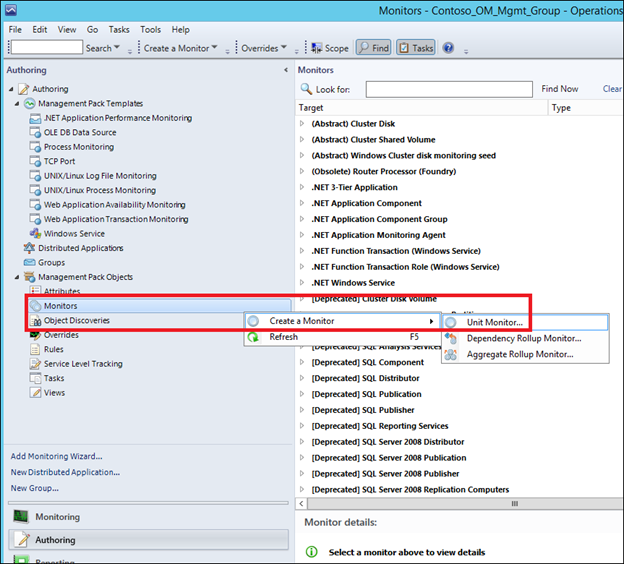
1) Navigate to Authoring and expand Management Pack Objects. Click Monitors>Create a Monitor>Unit Monitor:
2) Navigate to Windows Performance Counters>Static Thresholds> Single Threshold>Simple Threshold and change the Management Pack to something other <Select Management Pack> (It may be good practice to create a new one called something like 'Contoso SQL Performance Monitoring' , and click Next:
NOTE : This is a single threshold rather than a double threshold. A Single threshold has 2 states such as healthy and critical when the threshold is exceeded. A double threshold monitor has 3 states such as healthy, critical and warning and 2 thresholds are used to calculate which of these health states an object is in.

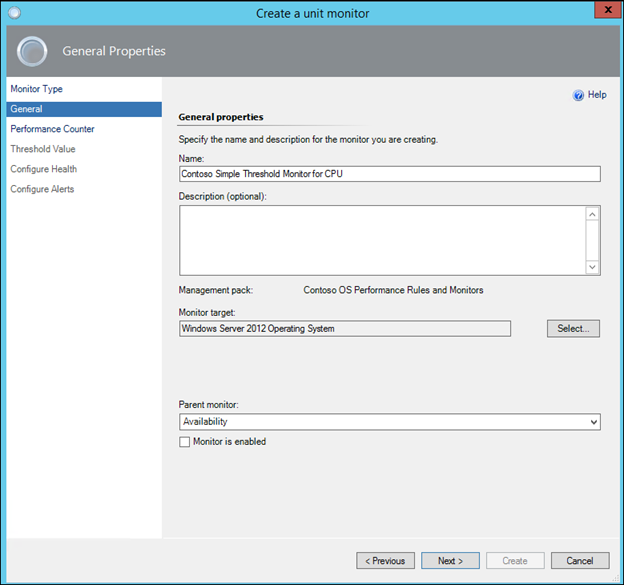
3) Give the monitor a name (For Example: 'Contoso Simple Threshold Monitor for CPU'), Select a Monitor Target that will be present on the computer you want to monitor the performance counter on. In this case an appropriate target is 'Windows Server 2012 Operating System', uncheck the 'Monitor is Enabled and then click Next
NOTE: It is best practice to use some form of prefix or three-letter acronym as a naming convention, to identify all of an organization's custom rules and monitors. This makes it much easier to find custom rules and monitors in the console when necessary.
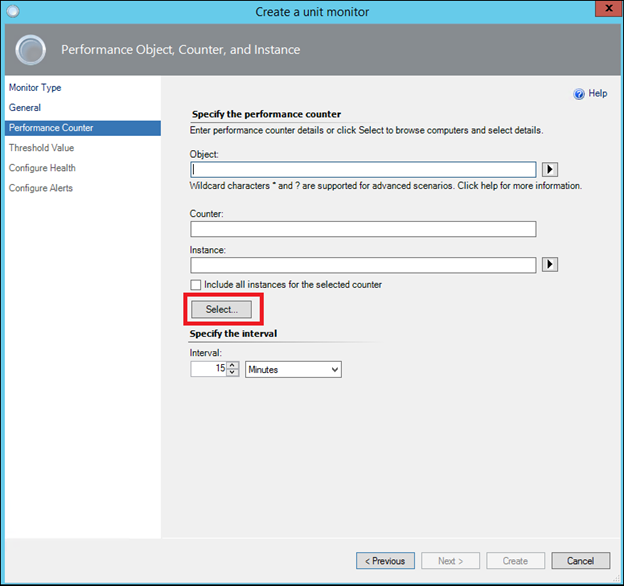
4) In the following dialog, click the 'Select' button;
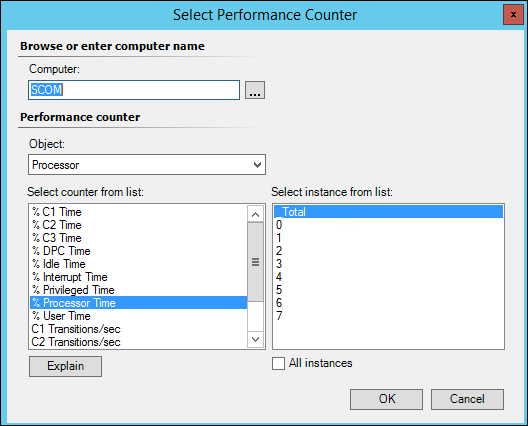
5) In computer, Browse to a computer that has the performance counter you need to monitor and the available object and counters in the list will refresh.
NOTE: This is purely for picking the correct counter. By selecting a computer to pick the counter from, you are not saying 'I just want to target this one computer'. Because in the previous dialogs we selected Windows Server 2012 Operating System, the performance counter rule will be activated on every Operations Manager agent where a Windows Server 2012 Operating System object and the counter picked out is found.
6) Pick the appropriate object and counter and click OK:
7) Configure the interval / instances as required and click Next:
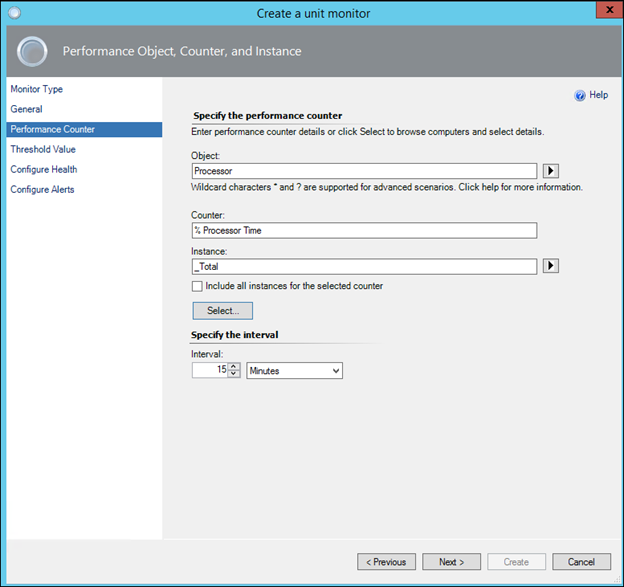
8) Type the desired threshold value and click Next:

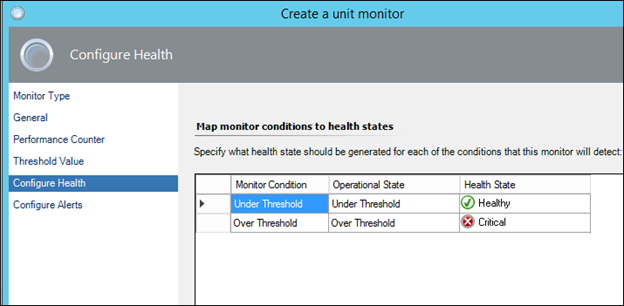
9) Reconfigure the states if necessary or leave the defaults and click Next:
NOTE: You may need to reverse the states in the 'Health State' column for example if you were monitoring Disk Space in MB, and wanted to change to critical if Over the threshold, and healthy if under the threshold
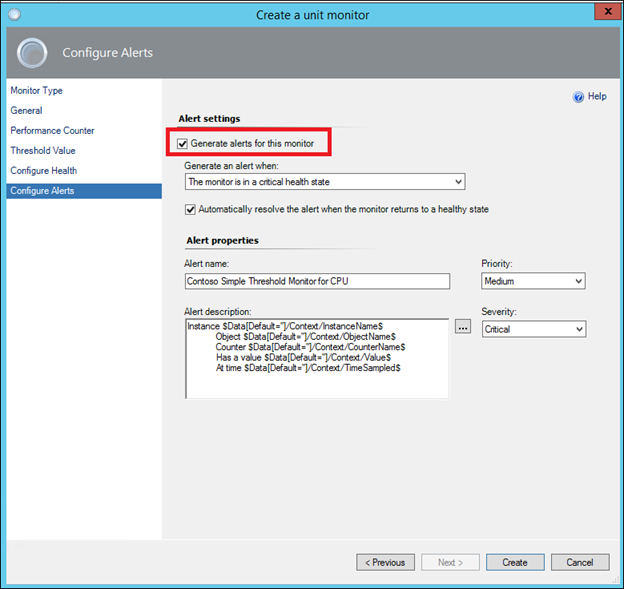
10) Place a check in the 'Generate Alerts for this Monitor' and optionally change the name to something more meaningful. Also reconfigure the other settings like severity if needed and click Create:
NOTE: If you ultimately intend to create a notification off this, if will be necessary to generate an alert as notifications are-alert-driven:
11) Find the Monitor using the Look For box:
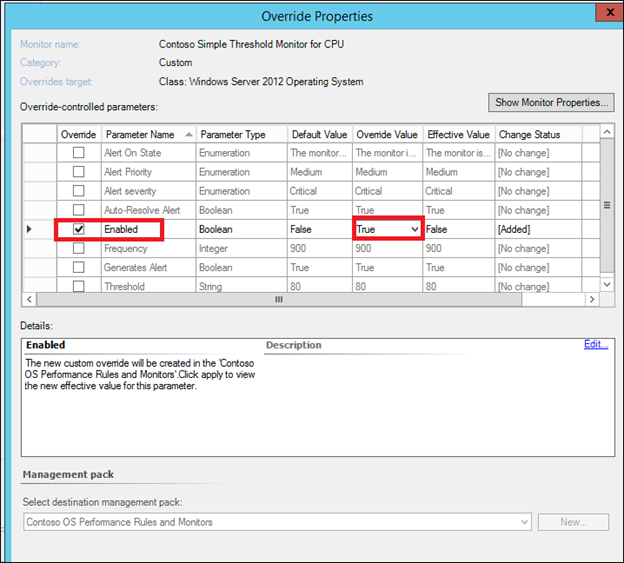
In Authoring>Rules use the 'Look for' box to find the monitor that you just created and Override the Rule for all objects of class, for a group, for a specific object depending on your scenario (which of these you wish to turn the performance monitor on for):
:
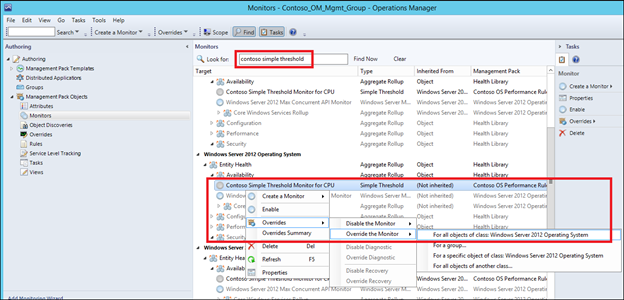
Place a check mark next to 'Enabled' and then change the override value from False to True, and then click OK to save the override:
NOTE: Any comments and feedback greatly appreciated if you found this post helpful or have any corrections / suggestions. Cheers, Antoni